25: Designing a Climate Resilient Community
Key questions for this investigation
- What are the current characteristics of your community?
- How might the community be impacted as its regional climate changes?
- How might the community be restructured to survive these changes?
- How might the community be restructured to limit even worse changes?
To investigate these questions you will be using several online tools to determine how to improve the climate resilience of a small town or neighborhood. This means that you will be looking at how to restructure a community to reduce its carbon emissions, sequester carbon where possible, and adapt to probable climate changes in the area. In doing so you will be addressing the four key questions.
Tools used in this investigation
- Biome Viewer < https://media.html.or/biointeractive/biomeviewer_web/index.html > developed by the Biointeractive Group of the Howard Hughes Medical Institute
- Future Climate Dashboard < https://climatetoobox.org/tool/Future-Climate-Dashboard > from the Climate Toolbox developed by the Applied Climate Science Laboratory at University of Idaho.
- Google Earth < https://www.google.com/earth/> from Google Inc.
- Project Drawdown Solutions Catalog < https://www.drawdown.org/ > developed by Project Drawdown.
- Surging Seas Risk Finder < https://riskfinder.climatecentral.org > developed by Climate Interactive.
Background
Today, 55% of the world’s population lives in cities. Estimates suggest that nearly 75% of global annual CO2 emissions come from urban areas1. As such the principal activities and structures that make up these communities include…
-
- Residential – Houses, apartment complexes, etc.
- Commercial – Shops and warehouses.
- Transportation – Trains, planes, trucks, autos, ships, bicycles, etc. and the structures needed to support them.
- Manufacturing – Factories, mines, etc.
- Agriculture – Farms
- Energy production – Power plants, mines, well fields, refineries.
The process of redesigning our communities to be climate resilient means redesigning these activities and structure so we can continue to provide for our needs while ensuring that future generations can do the same. This requires retaining and restoring the integrity of the natural systems on which we depend. To accomplish this is a two-part process that involves changing our communities to slow climate change by reducing net carbon emissions to near zero and altering our communities to survive natural disasters associated with unavoidable climate change. As a general rule of thumb, the more mitigation the global community does the less adaptation individual communities will have to do. Note – Economists, such as Nicholas Stern, argue that mitigation generally is less expensive than adaptation.
Investigation
Activity A – Current characteristics
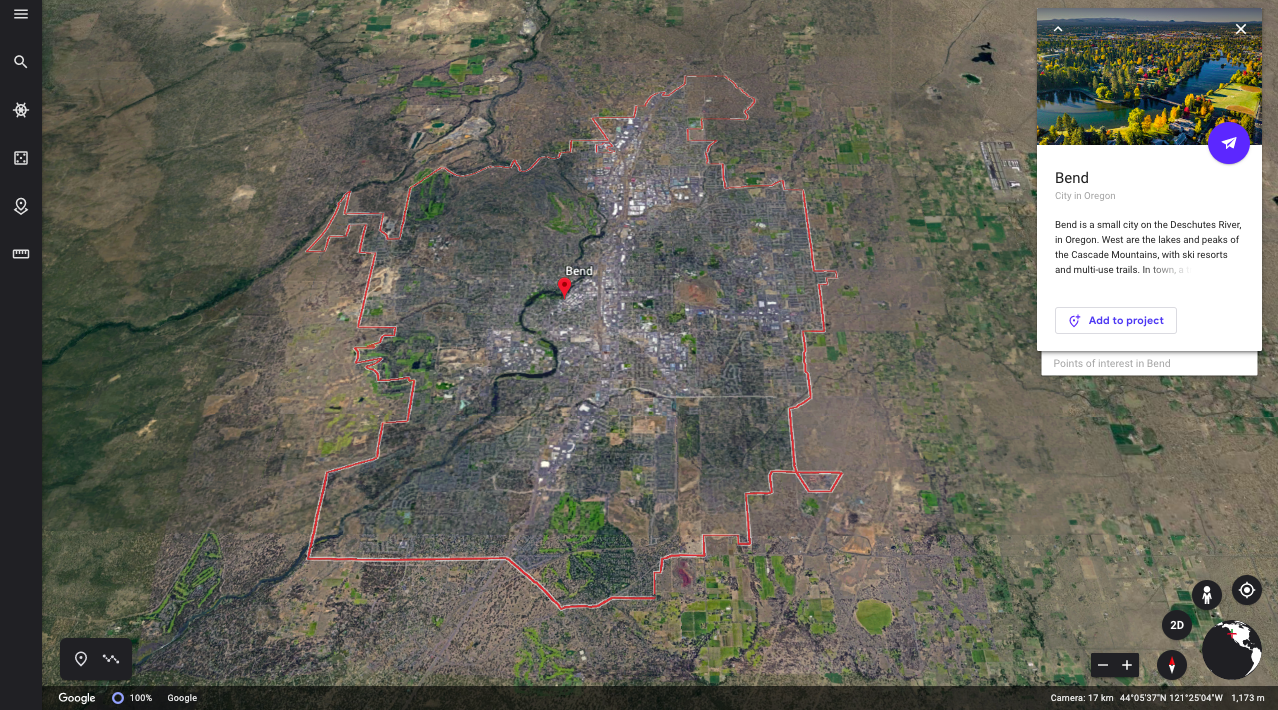
Begin by launching Google Earth < https://www.google.com/earth/>. Once the program has launched, locate the community (city, town, or village) you are interested in by typing its name in the search box that appears when you click on the magnifying glass icon in the upper left corner of the frame. This will access a 3D model of the community, which will be outlined in red and accompanied by an information panel in the upper right corner of the frame (Figure 1).
|
|
|
|
Figure 1 – An oblique view of Bend, Oregon as seen in Google Earth. The red line marks the city limits. The panel in the upper right is a panel containing basic information about the city. |
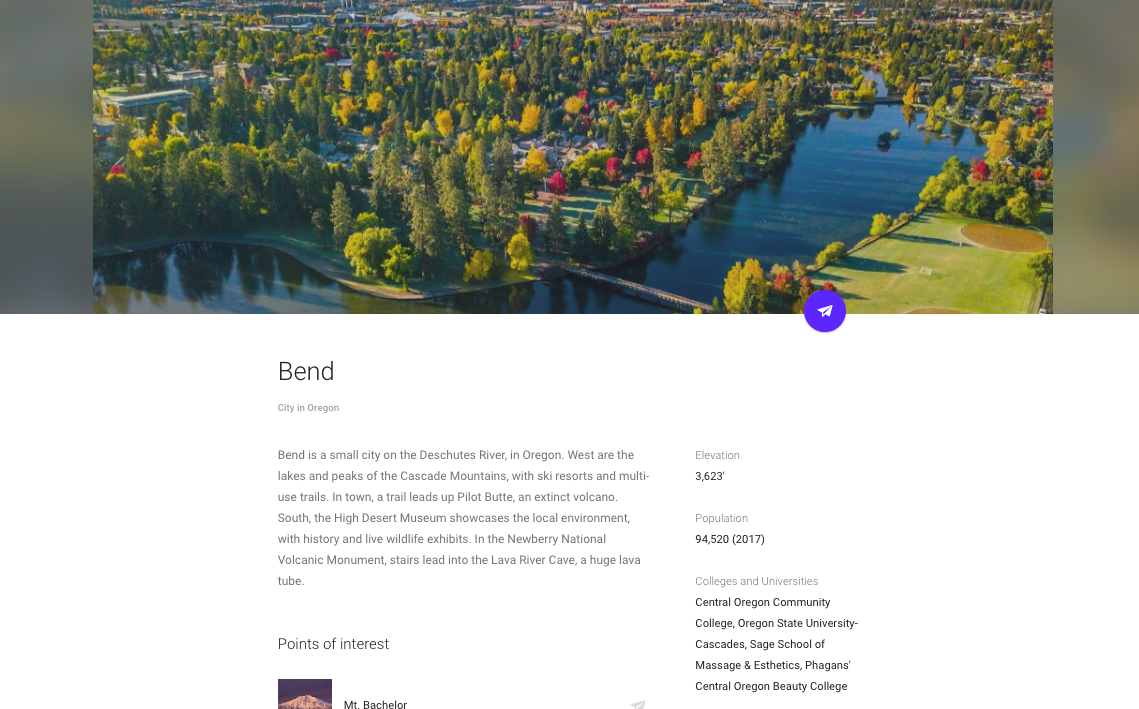
Figure 2 – An expanded information screen accessed by clicking on the information panel in the upper right corner of the frame shown in Figure 1. |
Questions – Community characteristics
- Where is this community? Latitude and longitude, continent, country, state or province.
- How big is it? Length, width, and area
- Is it a rural or urban community?
- The people of this community? How many people live in this place, ethnicity, income distribution, etc.
- What is the economic base of this place? The industry and business that is prominent in this community.
- What is the surrounding landscape like? Elevation, location (coastal or inland), rivers or streams that run through it, valleys it is in, surrounding mountains or hills, major geographic features.
- What biome is the community in? Name and describe its biome, and list some of the plants and animals native to it.
- What is the normal climate? This includes average annual temperature and total yearly precipitation. Seasonal average temperature and total precipitation. Seasons of interest include winter (December / January / February) and summer (June / July / August)
To help with questions 7 and 8 use another on-line atlas, Biome Viewer. Refer to Activity 3: Biomes and Climate Zones for operating instructions for Biome Viewer.
Activity B: Assessing impacts
Begin this activity by launching the Future Climate Dashboard < https://climatetoolbox.org/tool/Future-Climate-Dashboard >.
Questions – Climate impacts on your community
-
- What is the projected average annual temperature for your community in 2050 and 2100 under the business as usual (BAU) and enhanced ambition (EA) scenarios?
- What is the change in the number of extreme heat days (T > 95°F) projected for each scenario?
- What is the change in the number of freezing days (T < 32°F) projected for each scenario?
- What is projected change in annual and seasonal precipitation?
Before redesigning your community to meet the challenge of these changes, examine the following list of environmental and social impacts likely in an increasingly warmer world. Select those that are most relevant to your community and determine which part of your community would be most affected by each impact and how.
-
- Increasingly severe droughts during summers.
- Increase in the number and intensity of extreme heat events.
- Increase in precipitation and flooding during rainy seasons.
- Increase in slope failures from increased precipitation.
- Sea level rise – If this is an issue in your community use the Surging Seas Risk Finder to determine what parts of your community would be impacted by a 0.5 and 1.0 m rise in sea level. The sea level rises possible under BAU and EA scenarios.
- Changes in stream flow from diminishing glaciers and snowpack.
- Increase in coastal erosion from melting permafrost.
Activity C: Community Redesign for Adaptation
Propose some specific strategies that this community could implement to adapt to each significant impact. What strategies does the community already have in place? Which of these strategies would they need to improve on and how?
To address these questions, make a list of relevant impacts based on the list at the end of part B. For each impact list and describe a proposed or existing strategy and identify where in your community it is found or could be implemented.
Activity D: Infrastructure Redesign for Mitigation
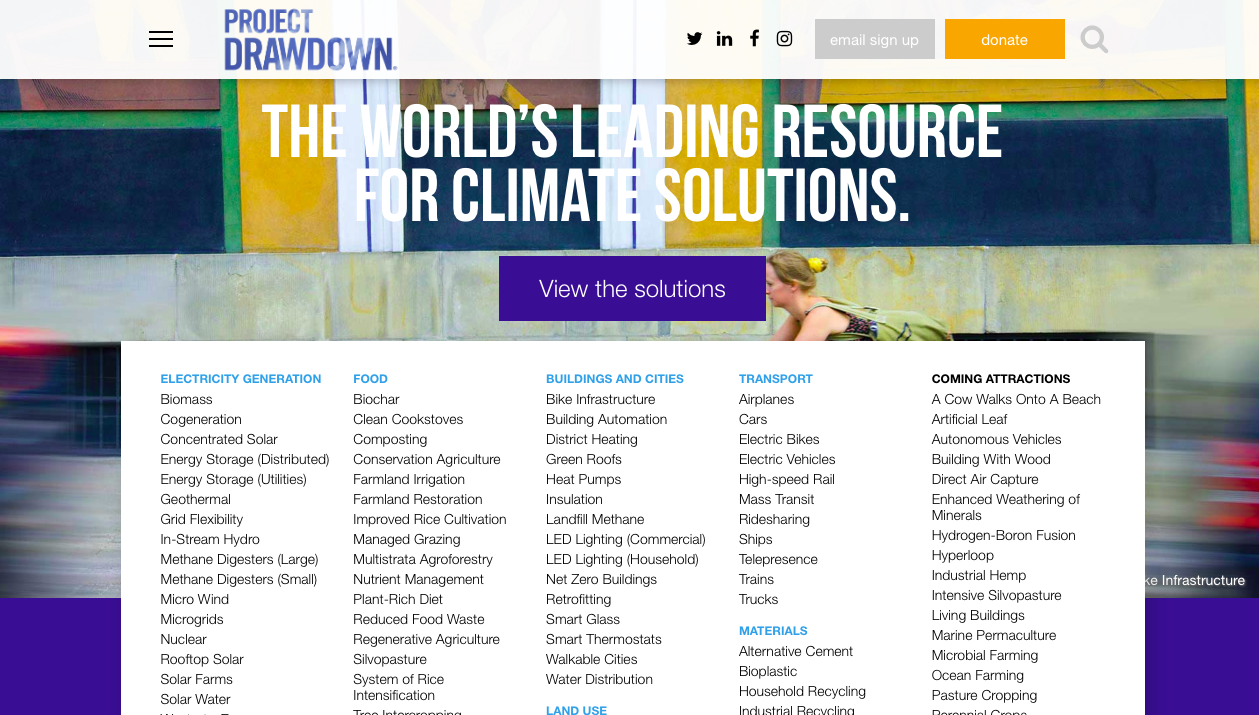
Use the Project Drawdown’s solution catalog < https://www.drawdown.org/ > to identify five specific strategies that this community could implement to reduce its carbon emissions. Also identify at least one strategy that this community could implement to sequester carbon. What has the community already started doing to reduce emissions or sequester carbon? Which of these strategies would they need to improve on and how?
As you list the mitigation strategies you selected for your community, describe each, discuss the impact of selecting this strategy (where does Drawdown rank it and why), and identify where in your community it is found or could be implemented.
 |
 |
 |
|
Figure 3 – Drawdown solutions catalog screen. Solutions are listed by general category. |
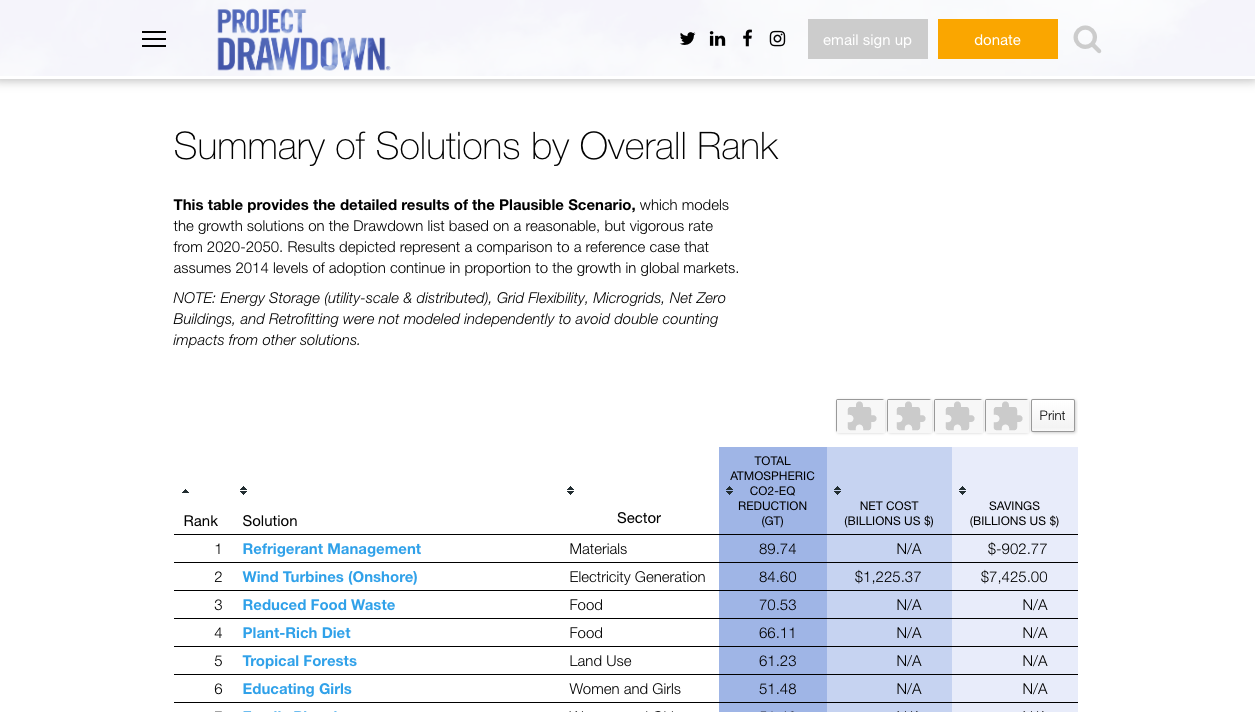
Figure 4 – Draw solutions listed by ranking in terms of their effectiveness for reducing or sequestering carbon. |
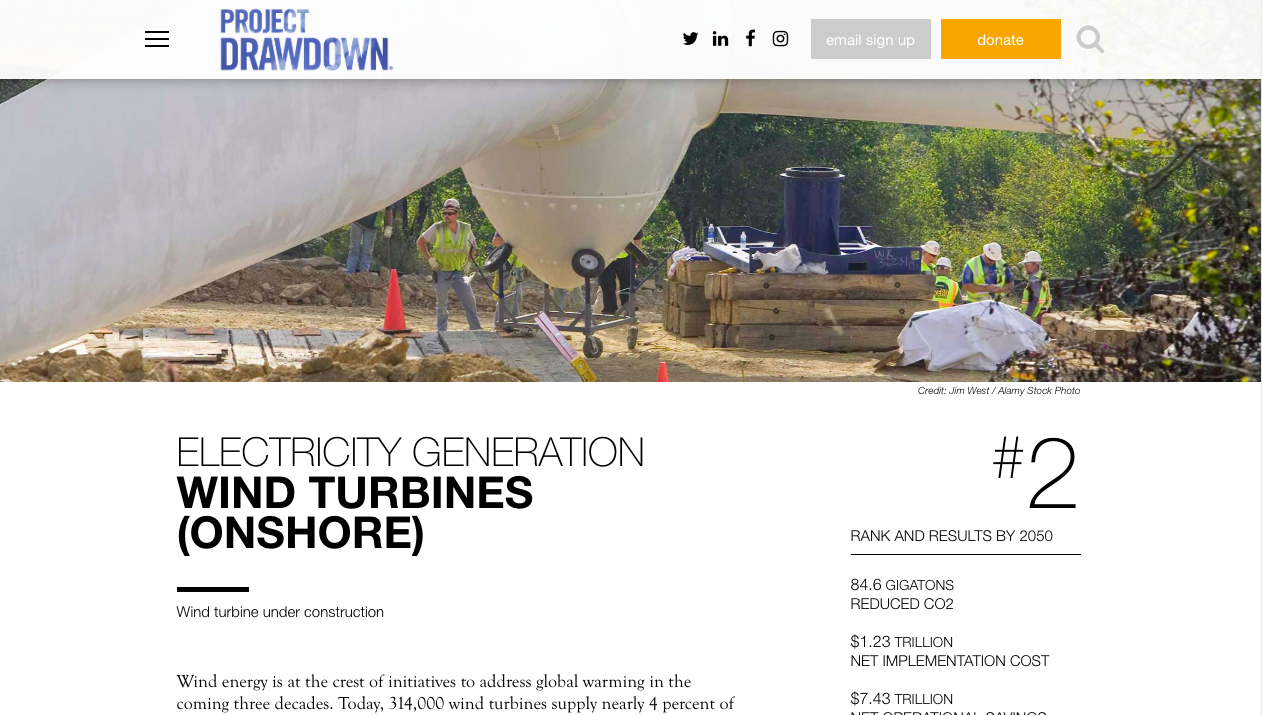
Figure 5 – Screen for a specific solution (in this case onshore wind turbines). |
