5: The Carbon Cycle
Key questions for this investigation
- How does carbon exist and flow within the earth’s climate system?
- How does the cycling of carbon regulate climate?
- How might human interaction with this cycle shape future climate?
Tools used in this investigation
- Carbon Cycle Interactive (1): Natural Flows
- Global CO2 Levels – Climate Dashboard from the 2° Institute
Background
A major player in changing climate is carbon in its various forms. This is in large part because of how increasing levels of carbon dioxide in the atmosphere are impacting the energy budget of the earth’s climate. Key to understanding this impact is understanding how carbon moves through the climate system via a process known as the carbon cycle.
The carbon cycle is the continuous exchange of carbon between living organisms, the oceans, atmosphere, and the earth’s crust. During this exchange various carbon compounds are continuously created, destroyed, and stored. Chief among these compounds are carbon dioxide (CO2), methane (CH4), calcium carbonate (CaCO3), and hydrocarbons (HxCy). The chief mechanisms by which this happens include…
- Respiration of animals, plants, and microbial life
- Production of methane via digestion and decomposition
- Photosynthesis by plants and microbial life
- Atmosphere-ocean exchanges
- Combustion of fossil fuels and vegetation
- Volcanic eruption
- Weathering of rock at the earth’s surface
Figure 1 is the title screen for the tool that you will be using for Activity A. The centerpiece of this screen is a diagram of the carbon cycle, showing both principle carbon flows and storages. One of your tasks in this activity will be to identify these exchanges and major carbon reservoirs. Your task in Activity B will be to investigate how we influence this cycle and the consequences of that influence.
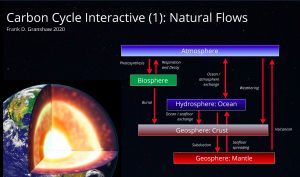
Figure 1 is a diagram of the global carbon cycle showing principal flows and storage of carbon in its various forms. The diagram is divided into five reservoirs connected with red arrows. The reservoirs you will probably recognize as the major planetary subsystems talked about in the introduction to this manual. The red arrows represent the principal types of carbon exchange between these reservoirs. If an exchange puts carbon into the atmosphere it is emitting carbon, if it is removing carbon then the exchange is sequestering carbon.
Residence time – In the case of the carbon cycle, this is the average length of time that carbon compounds remain in the various reservoirs shown in the diagram. Understanding how major greenhouse gasses influence the climatic energy balance of our planet is largely a matter of looking at the warming potential of these gasses and their abundance in the atmosphere. In turn, atmospheric abundance of these gasses is dependent on their atmospheric residence time.
The table below (Table 1) lists five key greenhouse gasses (GHGs). In addition to showing their approximate abundance in the atmosphere and their contribution to the greenhouse effect, it also shows their Global Warming Potential (GWP) and their atmospheric residence time. The latter is a measure of the warming potential of each gas relative to an equal mass of CO2. For instance, a kilogram of CH4 has 28 times the warming potential of a kilogram of CO2. However, CO2 contributes more to the greenhouse effect because of its higher abundance. Something that is strongly influenced by its longer residence time.
Table 1Key characteristics of principal Greenhouse Gasses. From Kiehl and Trenberth (1997) and Blasing T.J (2016) < https://cdiac.ess-dive.lbl.gov/pns/current_ghg.html > |
||||
|
Gas |
Abundance in the atmosphere (%) |
Atmospheric residence time |
GWP |
Greenhouse Effect Contribution (%) |
|
Water vapor (H2O) |
1 to 3 |
Hours – days |
n/a |
36 – 72 |
|
Carbon dioxide (CO2) |
~ 0.038 |
100 – 300 years |
1 |
9 – 26 |
|
Methane (NH4) |
~ 0.00018 |
12 years |
28 |
4 – 9 |
|
Nitrous oxide (N2O) |
~ 0.0006 |
121 years |
265 |
n/a |
|
Ozone (O3) |
~ 0.0006 |
Hours – days |
n/a |
3 -7 |
Because of CO2 abundance in the atmosphere, its effective atmospheric residence time, and the fact that it makes up such a significant percentage of human produced GHGs, CO2 emissions are what we often turn to first when looking at the human impact on the carbon cycle. With this in mind, we look at CO2 emissions in two ways.
First, is CO2 emission rates. This is the rate at which CO2 is released into the atmosphere. The last two questions in Activity look at historical changes in emission rates due to human activity and has you compare these to natural emission rates.
Second, is CO2 concentration in the atmosphere. This concentration is measured in parts per million (ppm). As a point of reference 1000 ppm is the same as 1%, so a CO2 concentration of 350 ppm is equivalent to 0.35%. Activity B looks as historical changes in CO2 concentration and has you compare this to changes in mean annual global temperature.
Investigation
Activity A – Examining the Carbon Cycle
Using Climate Cycle Interactive address the following questions…
- What is the total carbon storage in gigatons for each of the four major spheres of the earth? These spheres are the atmosphere, geosphere, oceans, and biosphere. Note in the diagram the geosphere is broken up into crust and mantle.
- How do these spheres compare in terms of their carbon storage? To answer this question rank them in terms of their total storage and calculate what percentage of the total global storage each represents.
- What are principal exchanges shown in the diagram? Which emit carbon into the atmosphere? Which sequester it?
- What is the total yearly flow rate of carbon into the atmosphere from all exchanges that emit carbon?
- What is the total yearly flow rate of carbon out of the atmosphere from all exchanges that sequester carbon?
- You have probably noticed when answering question 5 that no flow rate was available weathering. Assuming that for global average annual temperature to stabilize that emission should be equal to sequestration, what would you estimate the annual flow rate for weathering should be?
- The graph below (figure 2) shows global CO2 emissions since 1860. Given that the number you got for question 4 represents total annual natural emissions, how far above this baseline were all human emissions in 2012? Express this as a percentage of total annual natural emissions.
- Again referring to figure 2, what reservoirs shown in the carbon cycles diagram are humans drawing carbon from and emitting it into the atmosphere?
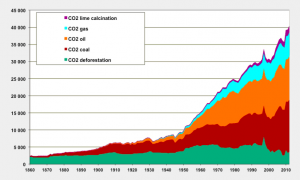 |
| Figure 2 – Global CO2 emissions since 1860 (adapted by Jean-Marc Jancovice from data from the Carbon Dioxide Information Analysis Center / US Department of Energy.
The emission units are in millions of tons per year. So 10,000 is actually 10 GT per year. CO2 lime calcination is involved in the production of cement |
Activity B – Human Impact on the Carbon Cycle
Using the interactive graph for Global CO2 Levels address the following questions…
- Unlike what you looked at in Figure 2, the CO2 Levels graph is showing you the concentration of CO2 in the atmosphere rather than annual CO2 emissions. Using this graph what was the atmospheric CO2 concentration in the year 1000 AD? What was it on the last date shown on the graph? If you move your cursor over the graph it will show these values.
- At what year do you see an abrupt rise in CO2 concentration?
- Zoom in to some place on the graph between 1958 and 2021. How does the graph look different here and why? Hint on answering the why – click on the three bars next to the 2° institute icon on the upper right. Select Data Source and Credits from the menu that appears when you do so.
- Finally click on the globe / thermometer icon in the upper left corner of the graph. This shows you the variation in annual mean global temperature from a long term average (temperature anomaly). What is the general correlation between CO2 concentration and global temperature? Are there places where that correlation is not readily apparent?
