10: Climate Changes – Temperature and Precipitation
Key questions for this investigation
- How has average annual temperature and precipitation changed from the last ice age until now?
- How might temperature and precipitation change between now and 2100 given an average global temperature that is 4°C warmer than now?
Tool used in this investigation
- Climate Reanalyzer from the Climate Change Institute / University of Maine < https://climatereanalyzer.org/ >
Background
The Environmental Change Model in Climate Reanalyzer presents projections of regional temperature, precipitation, and other environmental parameters based on global average temperature. The latter, written as “Global ∆T °C”, is actually degrees Celsius above or below the 1850 global average annual temperature.
All the negative values for ∆T (-6 to -0.5°C) correspond with either the Last Glacial Maximum (LGM) or the Little Ice Age. Both of these were cooling periods characterized by larger glaciers and ice sheets and lower sea level. The positive values (1 to 4°C) are associated with future dates. These are the projected date that a given ∆T will occur based on IPCC RCP-8.5. RCP is short for Representative Concentration Pathway, which are climate change projections based on changes in greenhouse gas emissions and atmospheric concentration. In RCP-8.5 atmospheric CO2 concentrations in the year 2100 resulting from increased emissions from human activities are forecasted to be nearly four times that of 1850 concentrations and three times current concentrations.
IPCC is short for Intergovernmental Panel for Climate Change, a UN related science review and advisory group who assemble scenarios like RCP-8.5 from a collection of climate models produced by researchers from around the planet.
Investigation
Activity A – Changes in Surface Air Temperature
To begin part A, launch Climate Reanalyzer < https://climatereanalyzer.org/ >
Next, select “Environmental Change Model” from the menu along the left side of the globe. Then select “World” from the “Region” pull down menu. Finally select “Temperature” from the “Parameter” menu.
This display you should get after doing all this should look like figure 1. It shows average annual surface air temperature for the entire planet
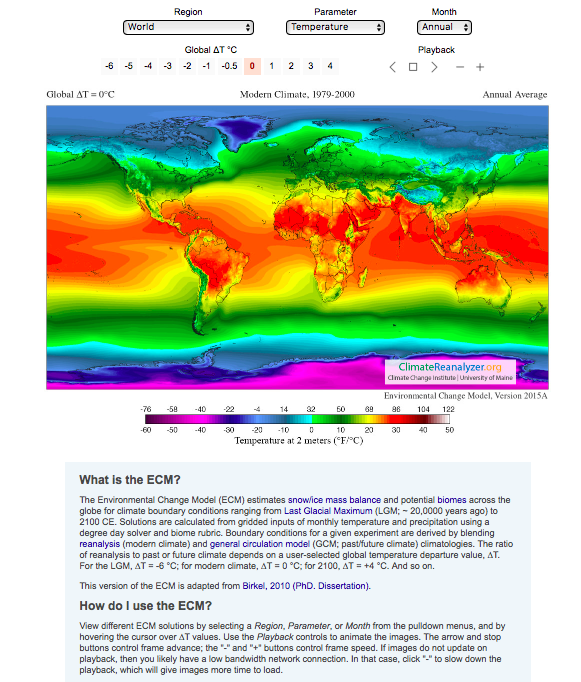 |
Figure 1Surface air temperature map from Climate Reanalyzer |
Questions to investigate with this map
- What global ∆T corresponds to what times? For instance, global ∆T = 0 corresponds to the Modern Climate, 1979-2000. Global ∆T is the difference between the global average annual surface air temperature for a given time period and the average annual SAT for 1979-2000.
- What happens to the band of tropical temperatures as you move forward in time from the Last Glacial Maximum (LGM) into the present?
- What happens to the band of Polar temperatures as you move from the LGM into the present?
- How does what you observed in questions 2 and 3 change as you move forward into 2100?
- What is the average annual temperature in the Arctic Ocean forecasted for 2100? What impact should this have on sea ice in that area?
- In 2100 which areas will have the highest average annual temperature?
Activity B – Changes in Precipitation
To begin this part of the activity, select “Precipitation” from the “Parameter” menu.
The display, which looks like figure 2, shows average annual precipitation for the entire planet. To look closer at a particular region, select the area you are interested in from the “Region” menu.
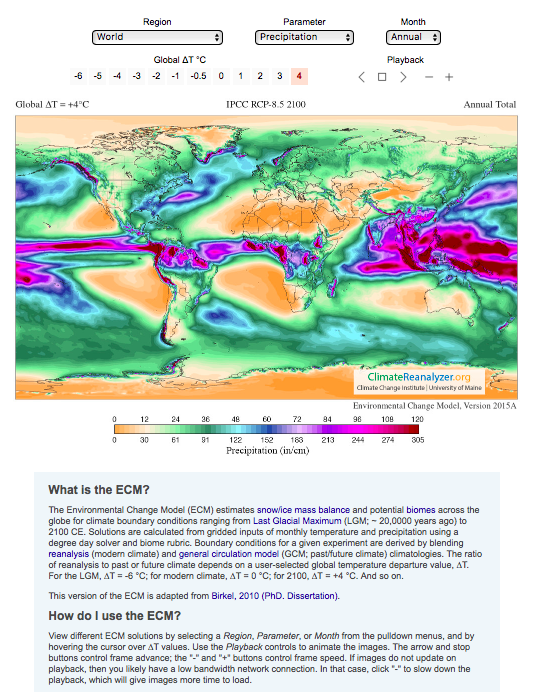 |
Figure 2Precipitation map selected from Climate Reanalyzer |
Questions to investigate with this map
- For present times (Modern Climate, 1979-2000) where are the driest and wettest places on the planet? The present is where Global ∆T = 0.
- Are there any significant patterns you notice in precipitation from this map?
- What changes do you notice in the general amount of precipitation and precipitation patterns as you go from present day (G∆T = 0) back to the LGM (G∆T = -6)?
- What changes do you notice in the general amount of precipitation and precipitation patterns as you go from present day (G∆T = 0) back to 2100 (G∆T = 4)?
- As you move from the present to the 2100 forecast, do you notice any places that get drier? Do you notice any places that get wetter? Where are they? Remember if you can’t quite make out an area you can zoom in on it using the “Region” menu above the map.
Activity C – Synthesis
Based on the results from of the previous two sections and any additional research you may need to do create some generalizations the impact of rising global temperatures on regional temperature and precipitation by answering the following questions.
- With rising global temperature what regions of the world show the greatest change in the regional temperature?
- How does rising global temperature correlate with changes in precipitation?
- Why are some parts of the world not affected equally by rising global temperature and general changes in global precipitation?
