2: Weather and Climate for a Single Station
Key questions for this investigation
- How are climate statistics calculated?
- How do we visualize weather and climate data in meaningful ways?
Tool used in this investigation
Weather data page for the Portland International Airport <https://www.wrh.noaa.gov/mesowest/getobext.php?wfo=pqr&sid=KPDX&num=72&raw=0 > from the National Weather Service.
Background
NOAA is a scientific agency within the United States Department of Commerce that focuses on the conditions of oceans, major waterways, and the atmosphere. As such NOAA is a major supplier of ocean and atmospheric data, a provider of stewardship services, and a major player in related research. < https://www.noaa.gov >
The National Weather Service or NWS < https://www.weather.gov > is a division of NOAA tasked with providing weather forecasts, hazardous weather warnings, and other weather products to business, public agencies, and the public for protection, safety and general information.
Since weather transcends national boundaries NWS frequently teams with sister agencies throughout the world through the World Meteorological Organization or WMO < https://public.wmo.int/en >. The WMO is an agency within the United Nations mandated to facilitate the flow of meteorological and climatic data between nations and provide a framework for international cooperation in related research.
Data accumulated by NOAA, NWS, WMO, and other related organizations is accumulated by several key tools. These include the following.
- Ground-based weather station are collections of fixed weather instruments that monitor air temperature, precipitation, wind speed and velocity, and humidity. Specialized stations also include devices for measuring solar radiation, cloud height and types, percent sky cover, and snow depth. Such stations regularly appear at airports, government buildings, schools and research centers.
- Doppler radar is a form of ground-based radar that is able to detect oncoming precipitation, determine what type of precipitation it is, and measure wind velocity. NEXRAD (Next Generation Radar) obtains all three types of data and so is often used to detect and analyze oncoming storm systems
- Weather buoys are floating instrument packages that are either moored along coastlines or able to drift with ocean currents. Since many storms originate offshore, weather buoys and satellites are key components of storm early warning systems.
- Airborne weather platforms include weather balloons or weather instruments mounted on aircraft. Data from these platforms is particularly important since the atmosphere and the weather taking place in it is three dimensional.
- Satellites are essentially orbital weather stations able to visualize large sections of the atmosphere. In addition to tracking the movement of large storm systems, satellites are able to measure wind velocity and direction at different heights within the atmosphere, track the concentration and movement of significant gasses like CO2 and water vapor, and track the flow of energy into and out of the atmosphere.
In this activity set you will be looking at information derived from a single ground-based station, an NWS facility at the international airport in Portland Oregon. Much of what you will be looking at is raw data that includes the following.
- Air temperature (AT) – The temperature of air in a shaded location that is approximately 2 m above ground level.
- Relative humidity (%RH) – The amount of water vapor in the air relative to how much it can hold at a given temperature.
- Dew point temperature (DPT) – The temperature air needs to be cooled (at a constant pressure) for it to reach RH = 100%.
- Wind speed (WS) – The average speed of the wind over a given period of time such as 15 minutes or half an hour
- Wind gust (WG) – The maximum wind speed recorded during a given period of time.
- Precipitation (Pct) – This is the amount of rain, snow, sleet, or hail that collects in a standardized container during a given period of time – In the case of the data you will be looking at this is volume of precipitation that collects in one hour.
Investigation
Activity A – Reading data from a single weather station
Begin by launching the NWS weather conditions page <https://www.wrh.noaa.gov/mesowest/getobext.php?wfo=pqr&sid=KPDX&num=72&raw=0 > . Once you have it you should see something like figure 1.
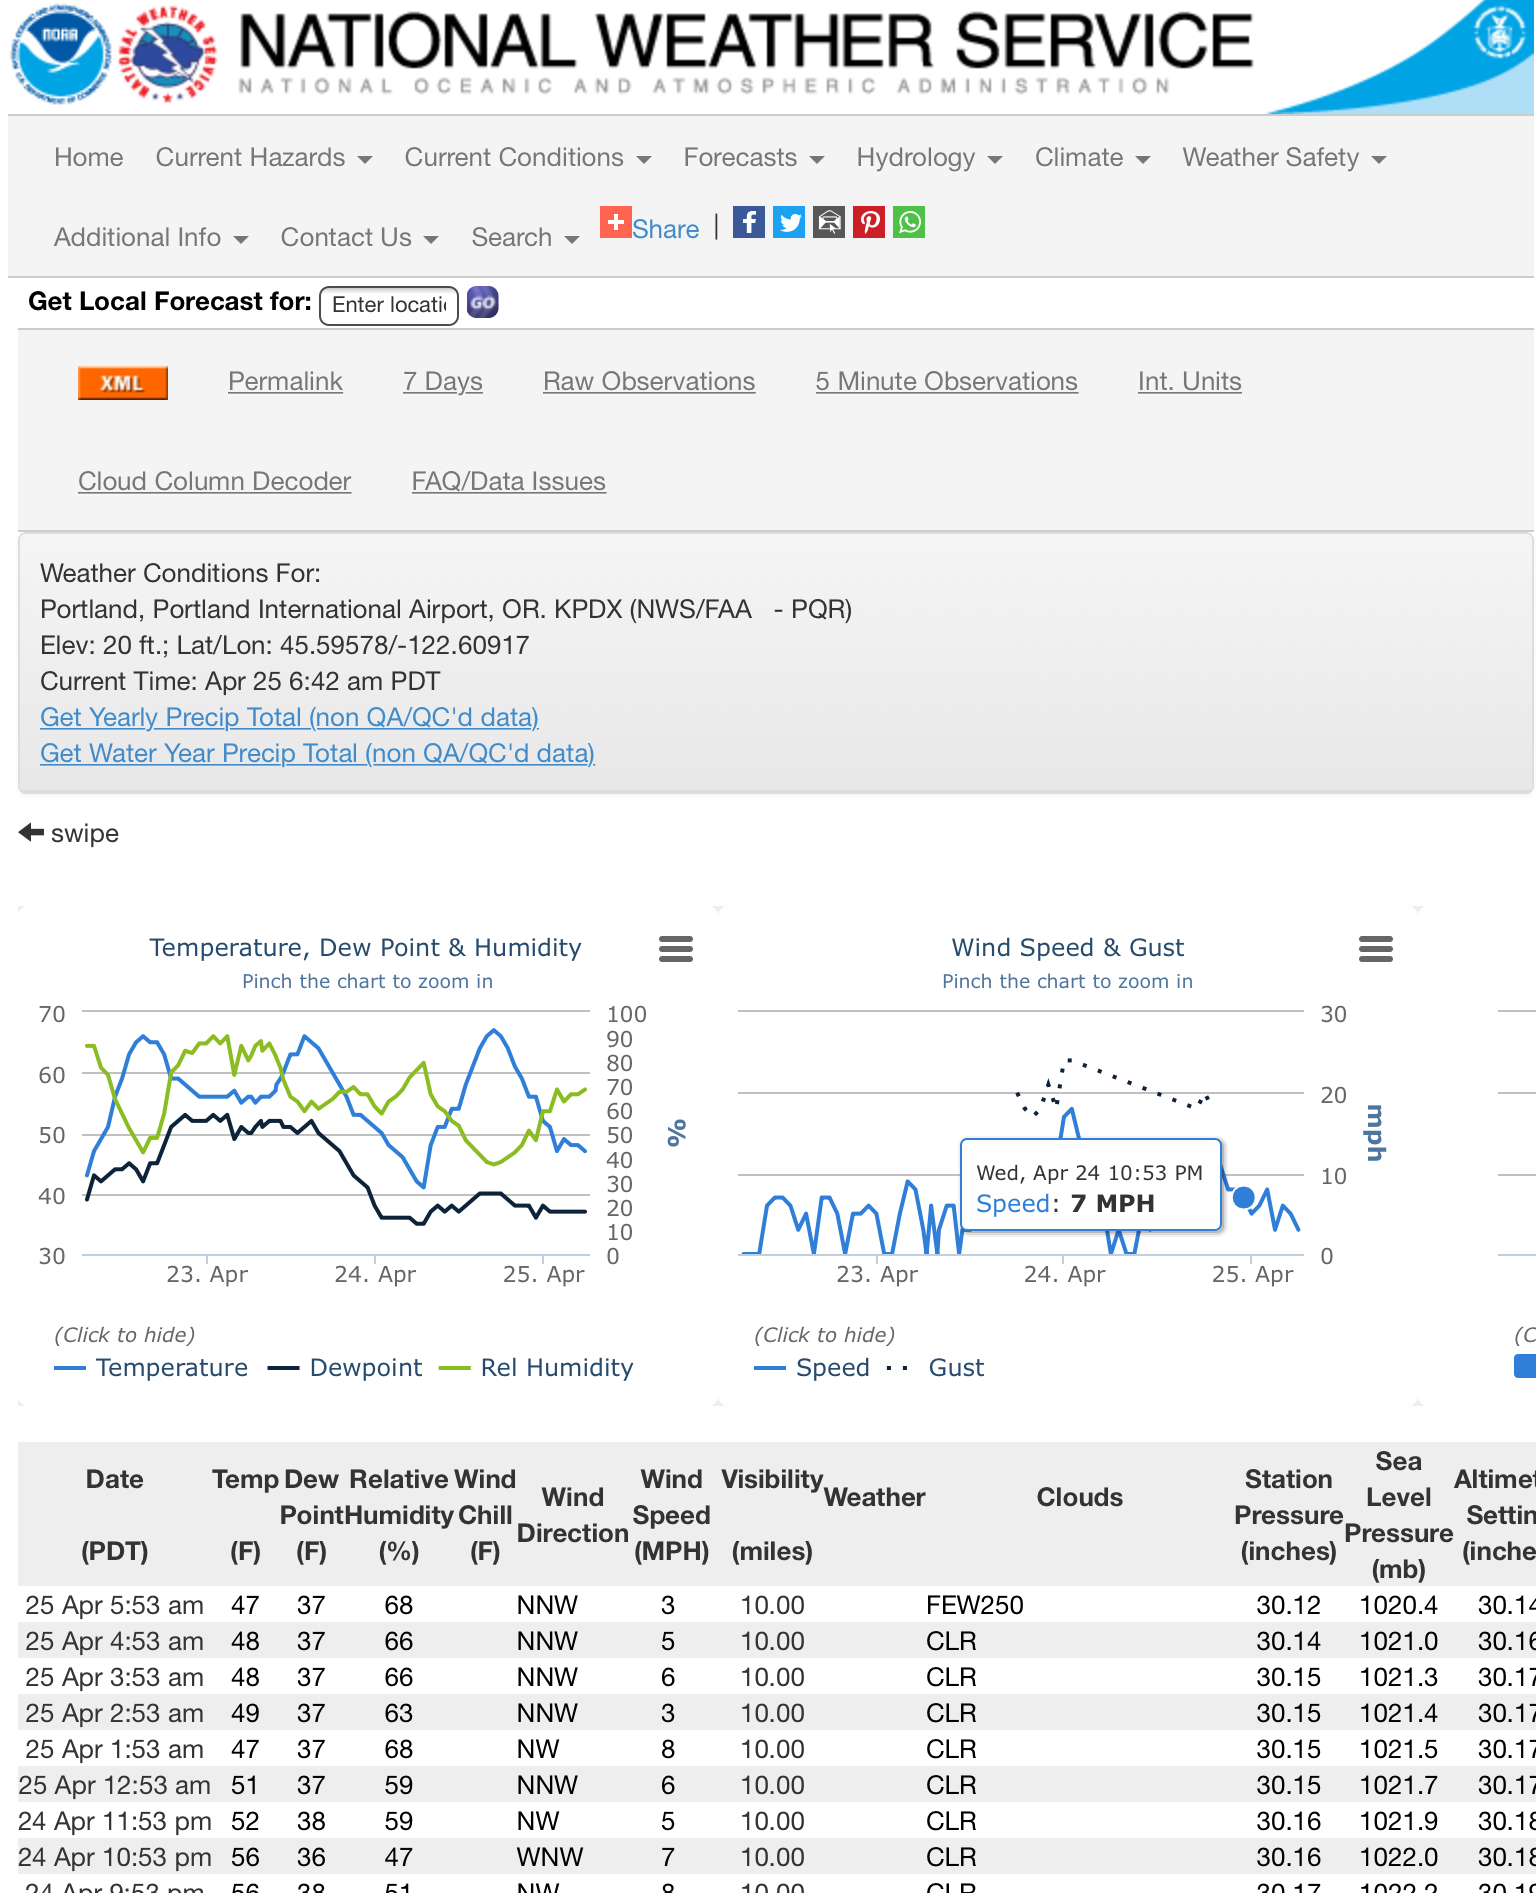 |
Figure 1: Main weather data page for the Portland International Airport.Portland Oregon This page includes station metadata (e.g. latitude, longitude, and elevation), graphs showing temperature, dew point, humidity, wind speed and gust, and 1-hour precipitation over a three-day period, and the raw data used to construct these graphs. The latter table also includes wind direction, visibility, air pressure, and cloud types.
|
Weather station data – Questions
- What is the latitude longitude and elevation of the station?
- What kinds of data are being shown for this station? List the data types and write a definition for each one?
- How is the data being shown on the page? A way of showing data is often referred to as a data visualization strategy.
- What for you are the strengths and limitations of each data visualization technique?
- Look at the graph of temperature, dew point, and relative humidity. What seems to be the relationship between air temperature and relative humidity?
Activity B – Calculating climate statistics for a single station
Many of the data pages on the NWS site include a mixture of observational weather data (what is at the moment), forecast (what’s likely), and climate data1 (what’s normal and what’s extreme). The page you are looking at right now is unique in that it’s only observational data. What we will do with it now is to calculate some short-range climate statistics.
Climate statistics – Questions
- What is the highest and lowest temperature for all three days?
- What is the temperature range for all three days?
- What is the average temperature for all three days? This one may take you a while with a calculator.
- Answer questions 1, 2, and 3 for each day
- How does the average for each day compare to the three-day average? The difference between the daily averages and the longer period average is referred to as a temperature anomaly.
- Finally graph of the temperature anomalies you calculated.
Footnotes
