1: Weather, Climate, and Climate Change – Mt. Rainier Washington
Key questions for this investigation
- How do you describe the weather of a specific place at a specific time?
- How do you describe the weather of this place over a period of time (climate)?
- How do you go about determining how the climate of this place has changed over time?
Tool used in this investigation
A virtual field site for Nisqually Glacier on Mt. Rainier Washington <http://vfeprojects.research.pdx.edu/WeatherClimateMORA >
Background
Weather is defined as the condition of the atmosphere at a specific time, often for a specific place. As such, it is directly observable making it much less abstract than climate. In observing weather, we break it down into elements that are discrete characteristics which vary over time and that are readily measurable (e.g. temperature or cloud cover).
Climate on the other hand, is a statistical portrait of the weather for specific places, regions, or even the entire planet. This information is meant to provide us a sense of what’s normal, what’s unusual, and what’s changing and how. To determine climate for a single station we use days, months, or years of data from that station to calculate averages and extremes of each of the elements observed at that station. To determine the climate of a region, we calculate these same statistics using data from several of the stations in the region. To calculate these statistics for the entire planet we use data from as many stations around the planet as is possible, as well as data from satellites and other mobile data collection platforms.
A weather report is like snapshot. By comparison, a climate record is a broad, long view of the data. The climate record enables us to see trends over the “noise” of the short-term fluctuations of our local, daily weather. Activity A in this investigation illustrates this idea by having you analyze weather and climate data from a weather station on that has been in operation at Mt. Rainier, Washington for nearly a century.
While determining how the climate of a place or region has changed over time is determined in part by direct observation of the weather, more often it is determined by looking at physical indicators referred to as climate proxies. These indicators include a broad range of chemical, geological, historical, and biological clues of past climatic conditions and changes. More about this in Investigation 11.
Activities B and C in this investigation involve looking at changes in the local climate of Mt. Rainier based on changes in size of one of its major glaciers, Nisqually Glacier.
See the additional resources at the end of this investigation for supplemental background information
Investigation
Activity A – Weather and Climate in Paradise
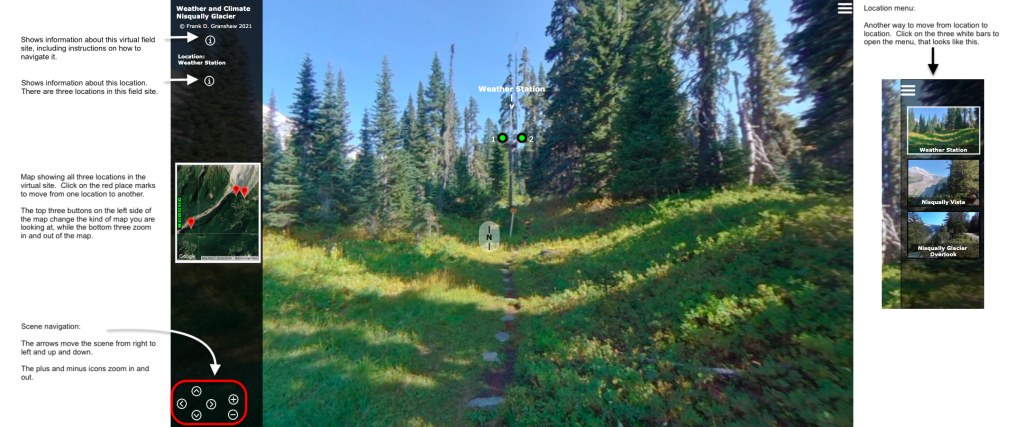
To start this activity, access the virtual field field site Weather and Climate Nisqually Glacier. This site is a interactive panorama of three location near Nisqually Glacier on Mt. Rainier. The location you will come to first is a weather station near the Paradise Ranger station that has been in operation since 1916. The weather station is visible to the north and is marked with a label and two green dots (figure 1).
 |
|
Figure 1 – Paradise RS Weather Station. This is what you see when you first open the virtual field site. The controls for navigating the site are marked on both sides of this figure. |
The weather at Paradise Ranger Station on 2 October 2020
Here you will be making simple observations of the weather at this location to answer the following questions.
- Without accessing the data from the weather station, how would you describe the weather at the date and time this photograph was taken? To do this make a list of the distinct elements of the weather you can see by looking around in the scene. For each element describe what you see.
- Access the weather for this station by moving your cursor over green dot #1. What weather elements are listed for this station and what is the value recorded for each station?
Daily weather statistics for 2 October 2020
To get a sense of what the rest of the day was like use the climate statistics in the bottom right corner of the same data panel that you used for the previous question.
3. What elements are listed in this panel and what are the values for each?
4. How do these values compare to the conditions recorded at 11 am?
5. What does your conclusion for question 2 tell you about the rest of the day?
Comparing daily weather statistics for 2 October 2020 to the longer term climate record
To make these comparisons use data panel #2 that is accessed by moving your cursor over green dot #2.
- How does the air temperature, precipitation, and snowfall for 2 October 2020 compare to the rest of October?
- How do these values compare to rest of 2020?
- How does the air temperature, precipitation, and snowfall for 2 October 2020 compare to the average value for 2 October from the 1916-2020 record?
- How does the October 2020 air temperature, precipitation and snowfall compare to the October average from the 1916-2020 record?
- How does the 2020 air temperature, precipitation, and snowfall compare to the annual average from the 1916-2020 record?
Activity B – Nisqually Vista
For this activity move to the second location, Nisqually Vista. This can be done using either the map on the left side of the scene or the location menu in the upper right. Figure 2 shows you what you should see when you do so.
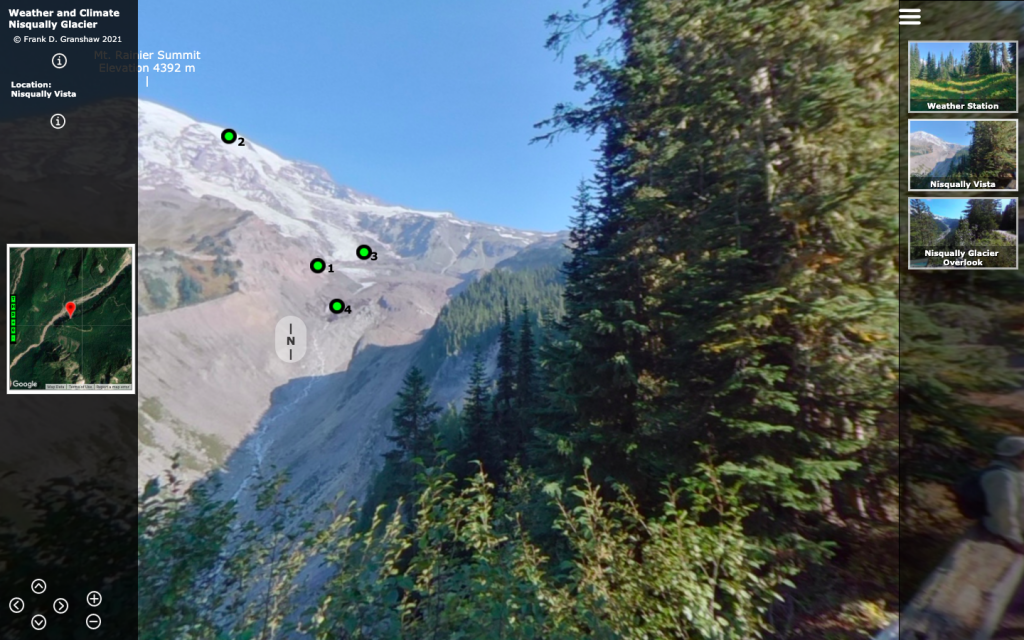 |
Figure 2 – Nisqually Glacier from Nisqually Vista |
An alpine glacier is a mass of ice that forms on mountain slopes and is able to flow downhill much like streams do, only much slower. Here are the mechanics that make this possible…
- In the upper reaches of the glacier, the zone of accumulation, more snow accumulates than melts each year. As old snow is buried by new snow, the old snow is compressed, eventually becoming ice.
- As the ice is buried deeper in the glacier it is able to flow, something that is evidenced by fracturing (crevassing) of the more brittle ice near the top of the glacier.
- At the lowest elevations of the glacier, melting outpaces snowfall. This section of the glacier (zone of ablation) is bounded by the terminus. The terminus marks the end of the glacier with the pile of material it was pushing, and is often accompanied by meltwater streams flowing from caves in the exposed ice.
Because of how they form, alpine glaciers are particularly sensitive to changes in regional climate. This sensitivity is important for three reasons. First, changing glaciers and the landforms they create are important indicators of changing climate (more about this in Activity C). Second, in areas with dry summers glaciers act as water storage, buffering summer stream flows important to agriculture, fish populations, hydroelectric power generation, and habitats (more about this in Investigations 18 and 21). Finally, as glaciers retreat, communities downstream from them become susceptible to increased flash floods as lakes and other landforms created by them fail.
As a first step in understanding all of this, use the four green dots in the Nisqually vista scene to answer the following questions. Refer to the four bold, italicized terms in the previous section.
- Referring to green dots 2 through 4, in which closeup do you see the bold italicized features mentioned in the previous paragraph on the mechanics of a glacier? The closeups appear when you move your cursor over the dots.
- Referring to green dot 1, find the lateral moraine. This is a pile of rock and sediment deposited along the side of the glacier when it was much larger. The crest of the moraine marks the former surface of the glacier several centuries ago. Dot 4 now marks the surface of the glacier now. What climatic changes could have taken place to cause the changes in the glacier visible in this scene?
- Dot 4 also marks the end of the glacier. At the time when the glacier surface was even with the crest of the lateral moraine, where would the end of the glacier be?
Activity C – Nisqually Glacier Overlook
For this final activity move to Nisqually Glacier Overlook. Figure 3 shows you what you should see when arrive at this location.
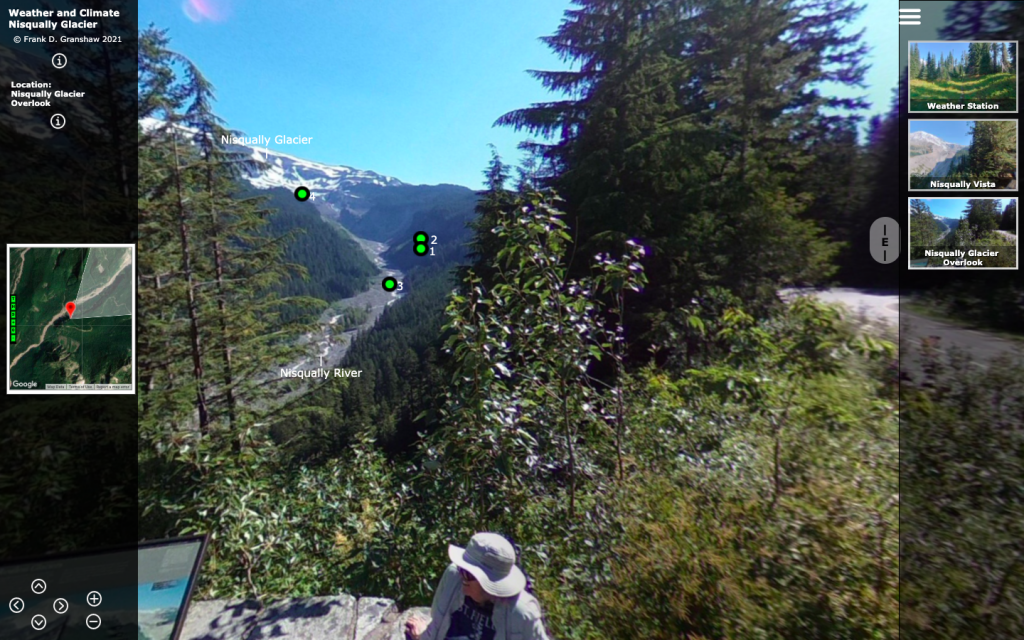 |
Figure 3 – Nisqually Glacier from Nisqually Glacier Overlook |
While the terminus of Nisqually Glacier is hidden in this view, the overlook does provide an excellent view of where the glacier has been. Using the closeups accessed by the four green dots in the view answer the following questions…
- Which dot corresponds to the current terminus of Nisqually Glacier? Which dot corresponds to terminus in 1912?
- Given your answer to question 2 in the last activity how has regional climate changed between 1912 and 2020?
- Using the graphs in closeup 2 and 3, how has climate changed between 1912 and 2020? The graphs in both closeups include bold black lines that show trends in the data. To address this question use those lines rather than the individual data points.
- On the basis of the the image accessed from green dot 4, how did regional climate change between 1840 and 2020? To determine this make a graph of terminus distance from the 2020 terminus vs. year.
- How does your answer to question 4 compare to the one you gave for question 2? What accounts for the differences in your answers?
