18: Climate and Energy Infrastructure
Key questions for this investigation
- What are the principal climatic conditions threatening the US energy infrastructure?
- How are these conditions threatening this infrastructure?
Tools used in this investigation
- Energy Sector’s Vulnerability to Climatic Conditions – US Department of Energy < https://www.energy.gov/articles/actonclimate-its-earth-week-energygov >
- Energy Flowcharts – Lawrence Livermore National Laboratory < https://flowcharts.llnl.gov/commodities/energy >
Background
In 2018 the US economy consumed over 100 quads of energy. A quad is equal to 29 trillion kilowatt-hours (kWh), where a kWh is roughly equivalent to the amount of energy required to operate your average toaster for one hour continuously. Of this 29 trillion kWh, 80% was supplied by burning fossil fuels,8% by nuclear fission, and the remaining 12% were derived from a constellation of renewable resources (Figure 1).
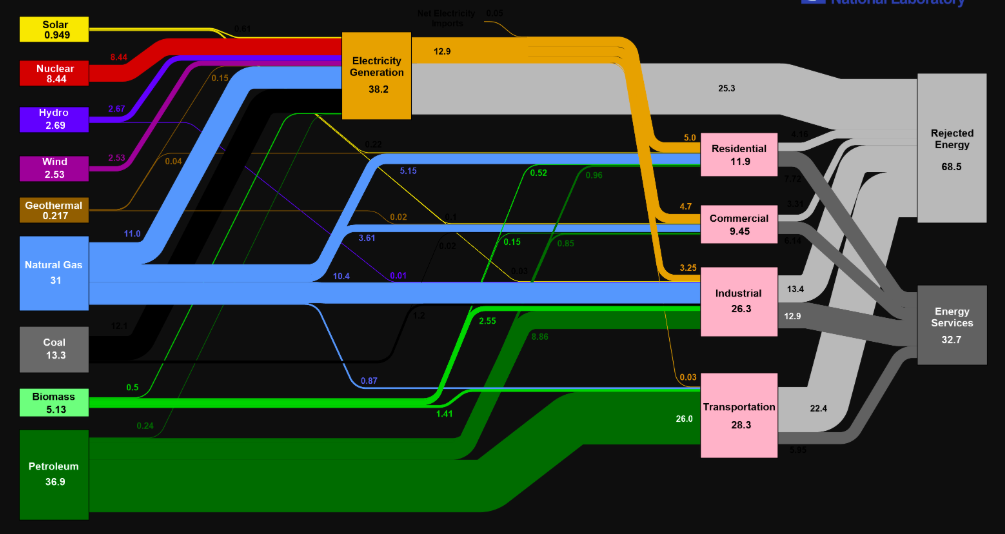 |
Figure 1 – A flowchart of 2018 US Energy Consumption and Production developed by the Lawrence Livermore National Laboratories https://flowcharts.llnl.gov/content/assets/images/charts/Energy/Energy_2018_United-States.png . |
As discussed in other parts of this manual, global society’s reliance on fossil fuels is a key factor in changing climate. One of the ironies of this dependence is that the climatic changes wrought by the use of these fuels threatens the structures used to produce and deliver energy derived from those and other resources. The infographic you will be using in these activities looks at key elements of the United States energy infrastructure that have been affected by extreme weather events, sea level rise, and other climatic stressors during the 21st century. This graphic was developed in 2013 by the US Department of Energy to summarize their report on this topic.
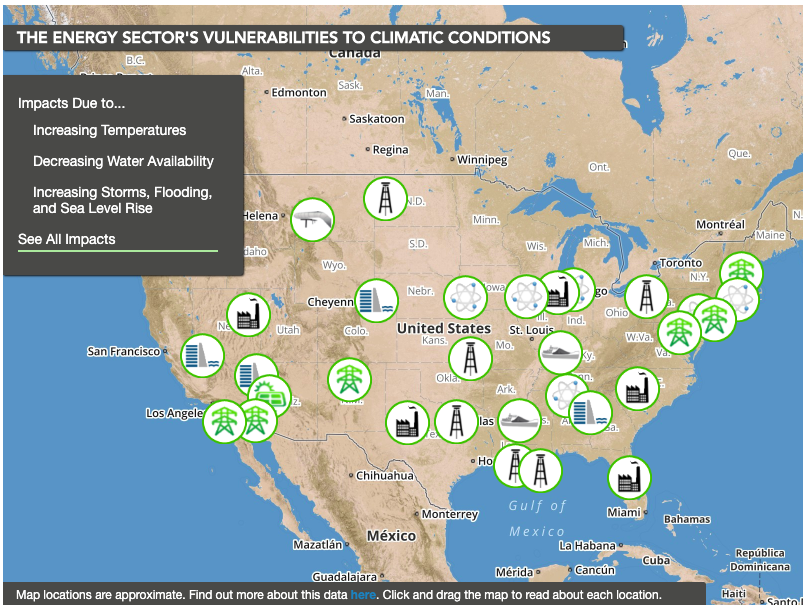
As shown in figure 2, the report lists five climatic conditions that pose some type of threat to the U. S. Energy Infrastructure. These conditions include the following…
- Increasing temperature – Included in this are rising air and water temperatures, increase in the frequency, duration, and intensity of extreme heat events, and melting permafrost.
- Decreasing water availability – Though it is generally agreed that a warming world will be a wetter one, this is not a consistent trend. While some areas see increased precipitation, others see longer and more intense drought.
- Increasing storms and flooding – With a warmer world comes additional heat energy fueling stronger storms. With these comes increased, high intensity precipitation resulting in increased flooding.
- Sea level change – Unlike flooding associated with heavy precipitation, sea level change results in flooding that can take place during clear as well as stormy weather. Furthermore, violent storms such as hurricanes often produce storm surges that augment high tides and heavy precipitation.
Investigation
Activity A – Investigating energy infrastructure and impact
Begin this activity by accessing the infographic The Energy Sector’s Vulnerabilities to Climatic Conditions < https://www.energy.gov/articles/actonclimate-its-earth-week-energygov >. This graphic (figure 2) appears on a US Department of Energy web page having the same title.
|
|
Figure 2 – The default appearance of for the infographic described above.Each of the icons represents a particular element in the national energy grid that has been affected by extreme weather events or changes in sea level. The list of climatic conditions in the upper left is a control panel enabling you to filter elements by the climatic conditions that have impacted them. |
US Infrastructure and Climate – Questions
- What are the principle types of energy infrastructure shown on the map? List and describe the types shown.
- What climate impacts are shown on the map? To answer this click on the three climate impacts in the upper-left panel to see which energy infrastructure facilities are affected by each. To record this use an entire sheet of paper to make a table that will summarize the climate change impact on each infrastructure type.
- How does each impact affect each type of infrastructure? To answer this, click on each climate change condition, read through the bubbles for each infrastructure type, and summarize how the climatic conditions impact each infrastructure type.
Activity B – Filling in the gaps
The infographic used in these activities only shows impacted infrastructure in the continental United States. Alaska has not been included. However, it too contains energy infrastructure that is vulnerable to changing climate conditions. Answer the following questions, given the energy flow chart showing energy production and consumption in Alaska (figure 3) and what you concluded in activity A.
Alaska Infrastructure and Climate – Questions
- Based on figure 3 what types of energy infrastructure would you expect to find in Alaska?
- What parts of Alaska would be affected by each of the climatic conditions listed in the control panel on the map? You may wish to consult the fourth National Climate Assessment chapter on Alaska: <https://science2017.globalchange.gov/chapter/11/>
- How would the infrastructure you listed in question 3 of this activity be impacted by conditions you listed in question 2?
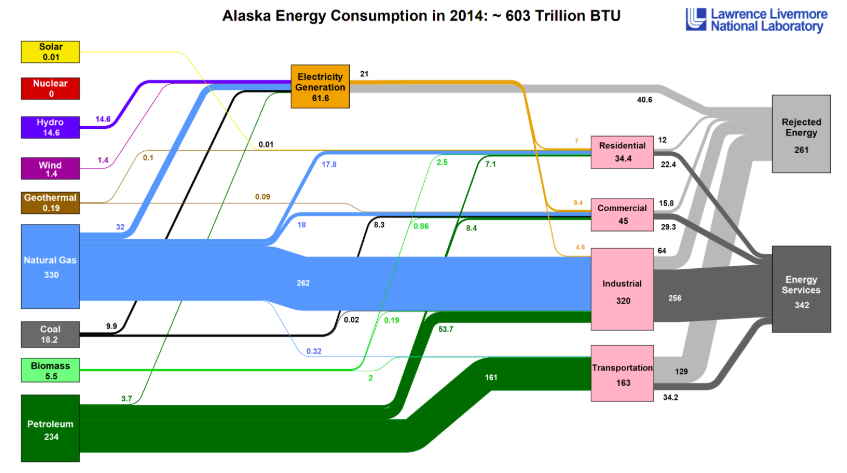 |
Figure 3 – Energy consumption and production flowchart for Alaska (2014).The resources used to provide energy are shown on the left side of the graph. Note energy export is not clearly shown in the flowchart and Alaska is a major fossil fuel exporter.https://flowcharts.llnl.gov/content/assets/images/charts/Energy/Energy_2014_United-States_AK.png |
