12: Climate Change and Earth History
Key questions for this investigation
- What is geologic time?
- How has the Earth’s climate changed during its history?
Tool used in this investigation
- Earth Viewer < http://media.hhmi.org/biointeractive/earthviewer_web/earthviewer.html > from the Biointeractive program at the Howard Huges Medical Institute
Background
There are two pieces of background that are important for these activities. The first is how earth scientists tell time, and the second is the major elements involved in recounting the Earth’s climate history.
In regard to earth history researchers customarily resort to something called the geologic calendar. In a nutshell the calendar is a global timeline of the events that have shaped the current structure of the planet. As such it extends back in time to the Earth’s formation, nearly 4.5 billion years and it is divided into major segments on the basis of the appearance and disappearance of major types of life as evidenced by the fossil record. The latter is a term used by paleontologists to refer to the total number of fossils that have been discovered to date. One of the goals of activity A on the following page is to familiarize yourself with the divisions of the calendar and the types of life common to each division.
In regard to the elements that make up a climate history the key ones that appear in Earth Viewer that you will be working with in these activities are as follows…
- Mean global air temperature – An average annual temperature for the entire planet. Largely inferred from oxygen isotopes in marine carbonates.
- Luminosity – The energy from the sun received at the top of the atmosphere measured in percentage of the Suns current output. Based on stellar evolution modeling.
- Day length – The average annual day length. Calculated from modeling of the formation of the Earth’s core and tidal dissipation.
- CO2 – The amount of carbon dioxide in the atmosphere in parts per million (ppm). Modeled using geochemical data from the carbon cycle.
- O2 – The amount of oxygen in the atmosphere expressed in percentage of total gas volume. Based on data from carbon and sulfur cycles.
Investigation
Activity A: Becoming familiar with Earth Viewer and the Geologic Time Scale
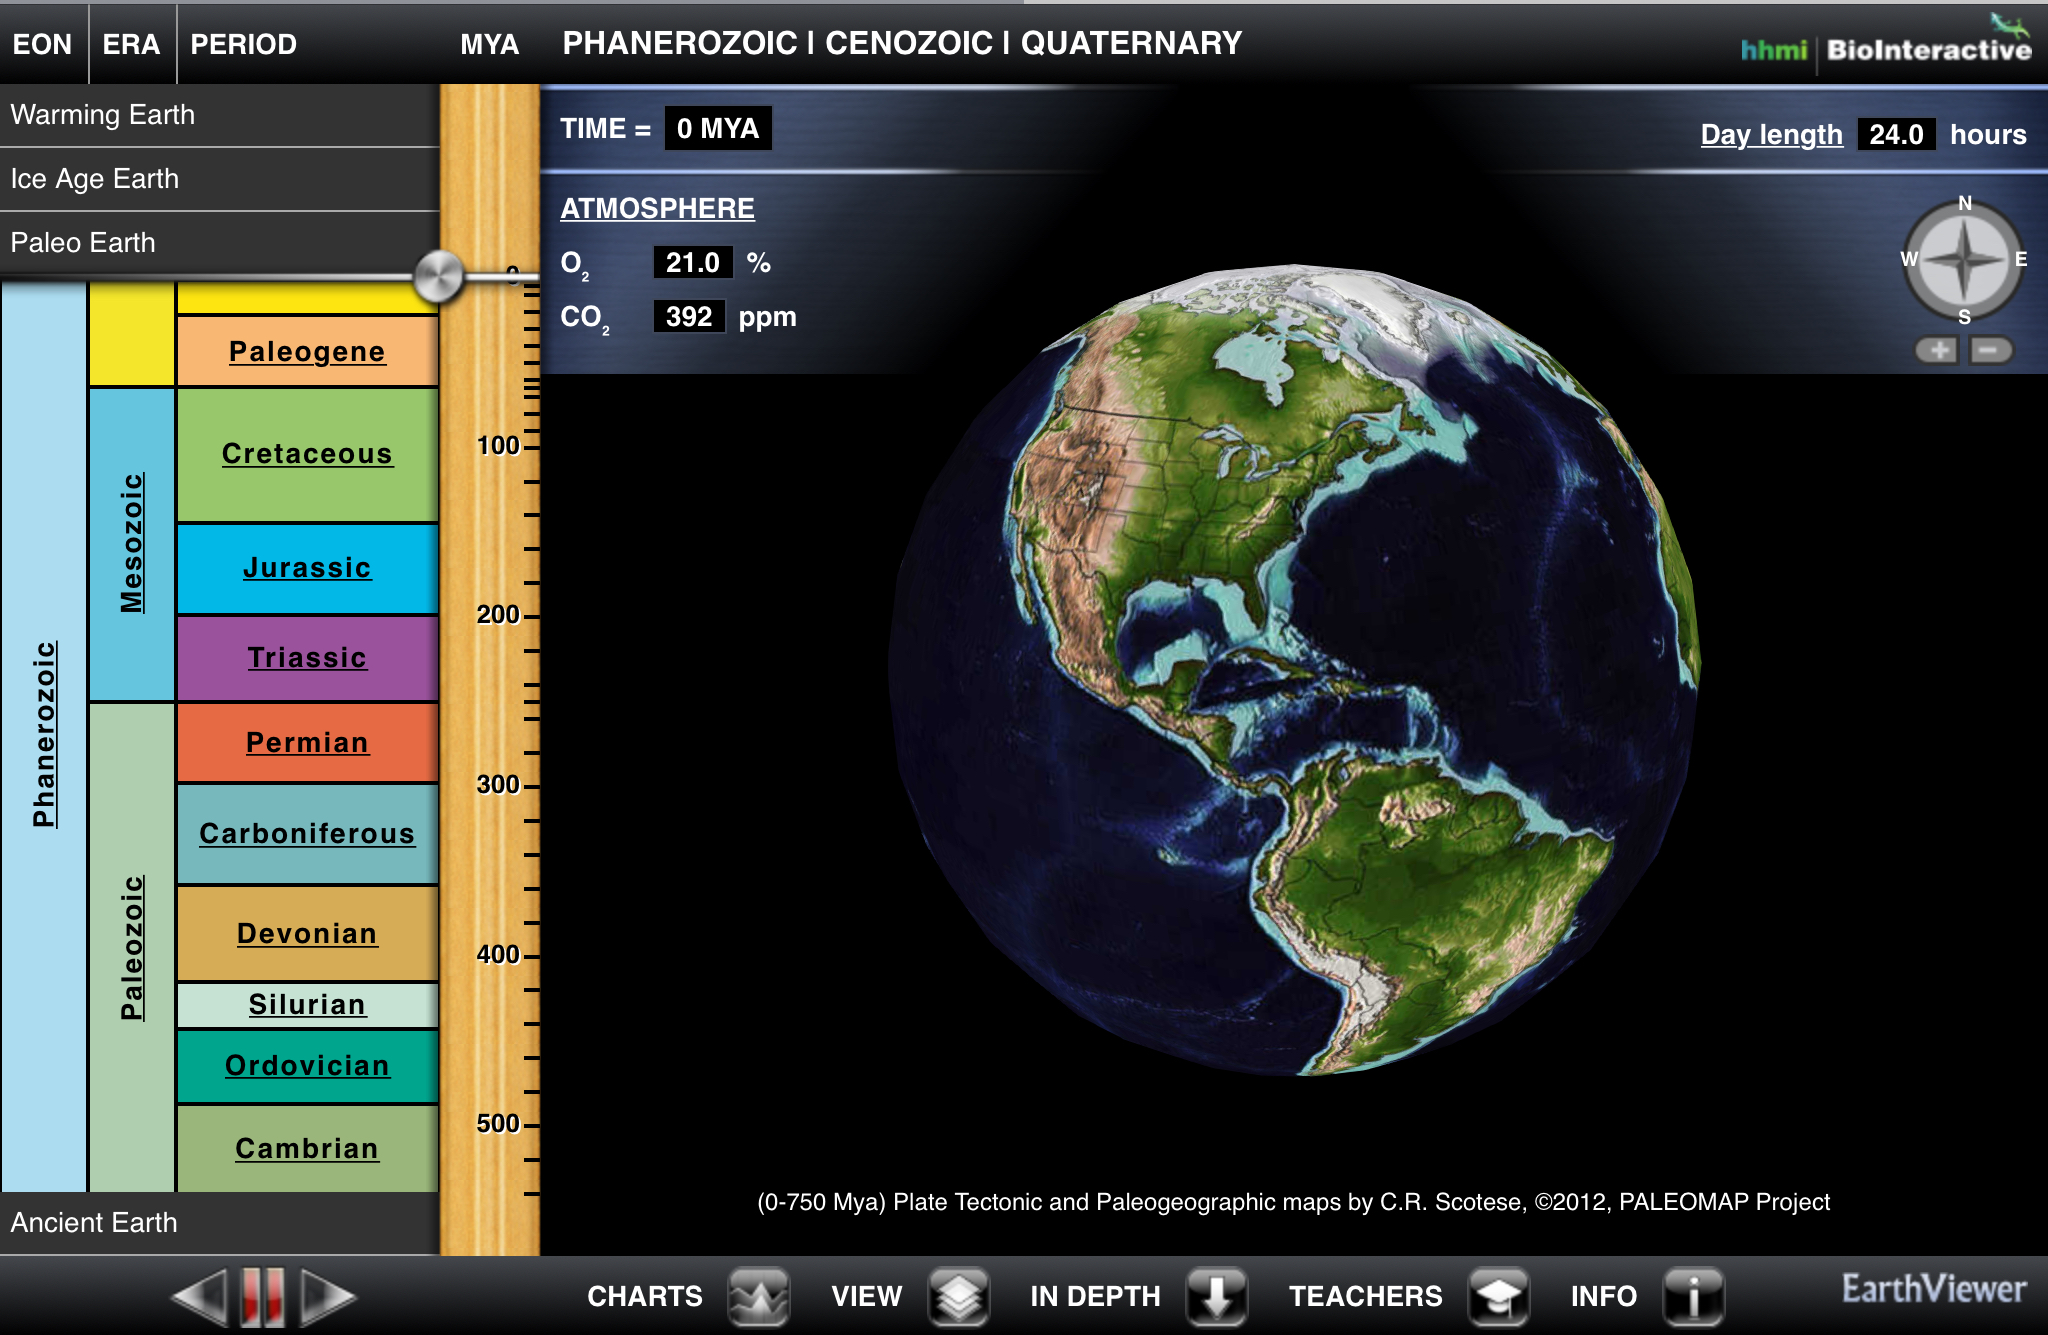
Begin by launching Earth Viewer < http://media.hhmi.org/biointeractive/earthviewer_web/earthviewer.html >. On the right side of the frame you see a globe that you can rotate. On the left side is a graphic timeline that you use for seeing the earth at different times in its history. There are actually four timelines available in this Atlas. One of these, “Paleo Earth”, is visible when you first launch the viewer and encompasses the last 550 million years of earth history. “Ancient Earth” shows all of earth history. “Ice Age Earth” goes from 21,000 years ago to 8,000 years into the future – The last 8000 years of this timeline (future) being based on climate modeling. The final timeline, “Warming Earth”, displays changes in average annual temperature from 1912 to 2012.
|
Figure 1 – Default screen for Earth viewer. The multi-colored chart on the left side of the screen is an interactive time scale / time scale. The task bar across the bottom accesses various types of information. Additional controls and data displays appear above the globe. |
Using both the “Paleo Earth” and “Ice Age Earth timelines answer the following questions…
- What is the Phanerozoic? To do this find this term in the timeline and click on it. When you answer the question identify how long it lasted, when it started and when it ended, what happened in terms of life, and what the name means.
- What are the three major divisions of the Phanerozoic? List and describe each of these.
- What is the Pleistocene?
- What is the Quaternary?
- What is the Anthropocene?
Activity B – Tracking Geographic and Climatic Change
Reset the viewer timeline to “Paleo Earth”. Using your finger or cursor (depending on whether you are using a tablet or a computer) click and drag on the timeline slider. This should move you back and forth through time, in which case you will see the geography of the planet change.
|
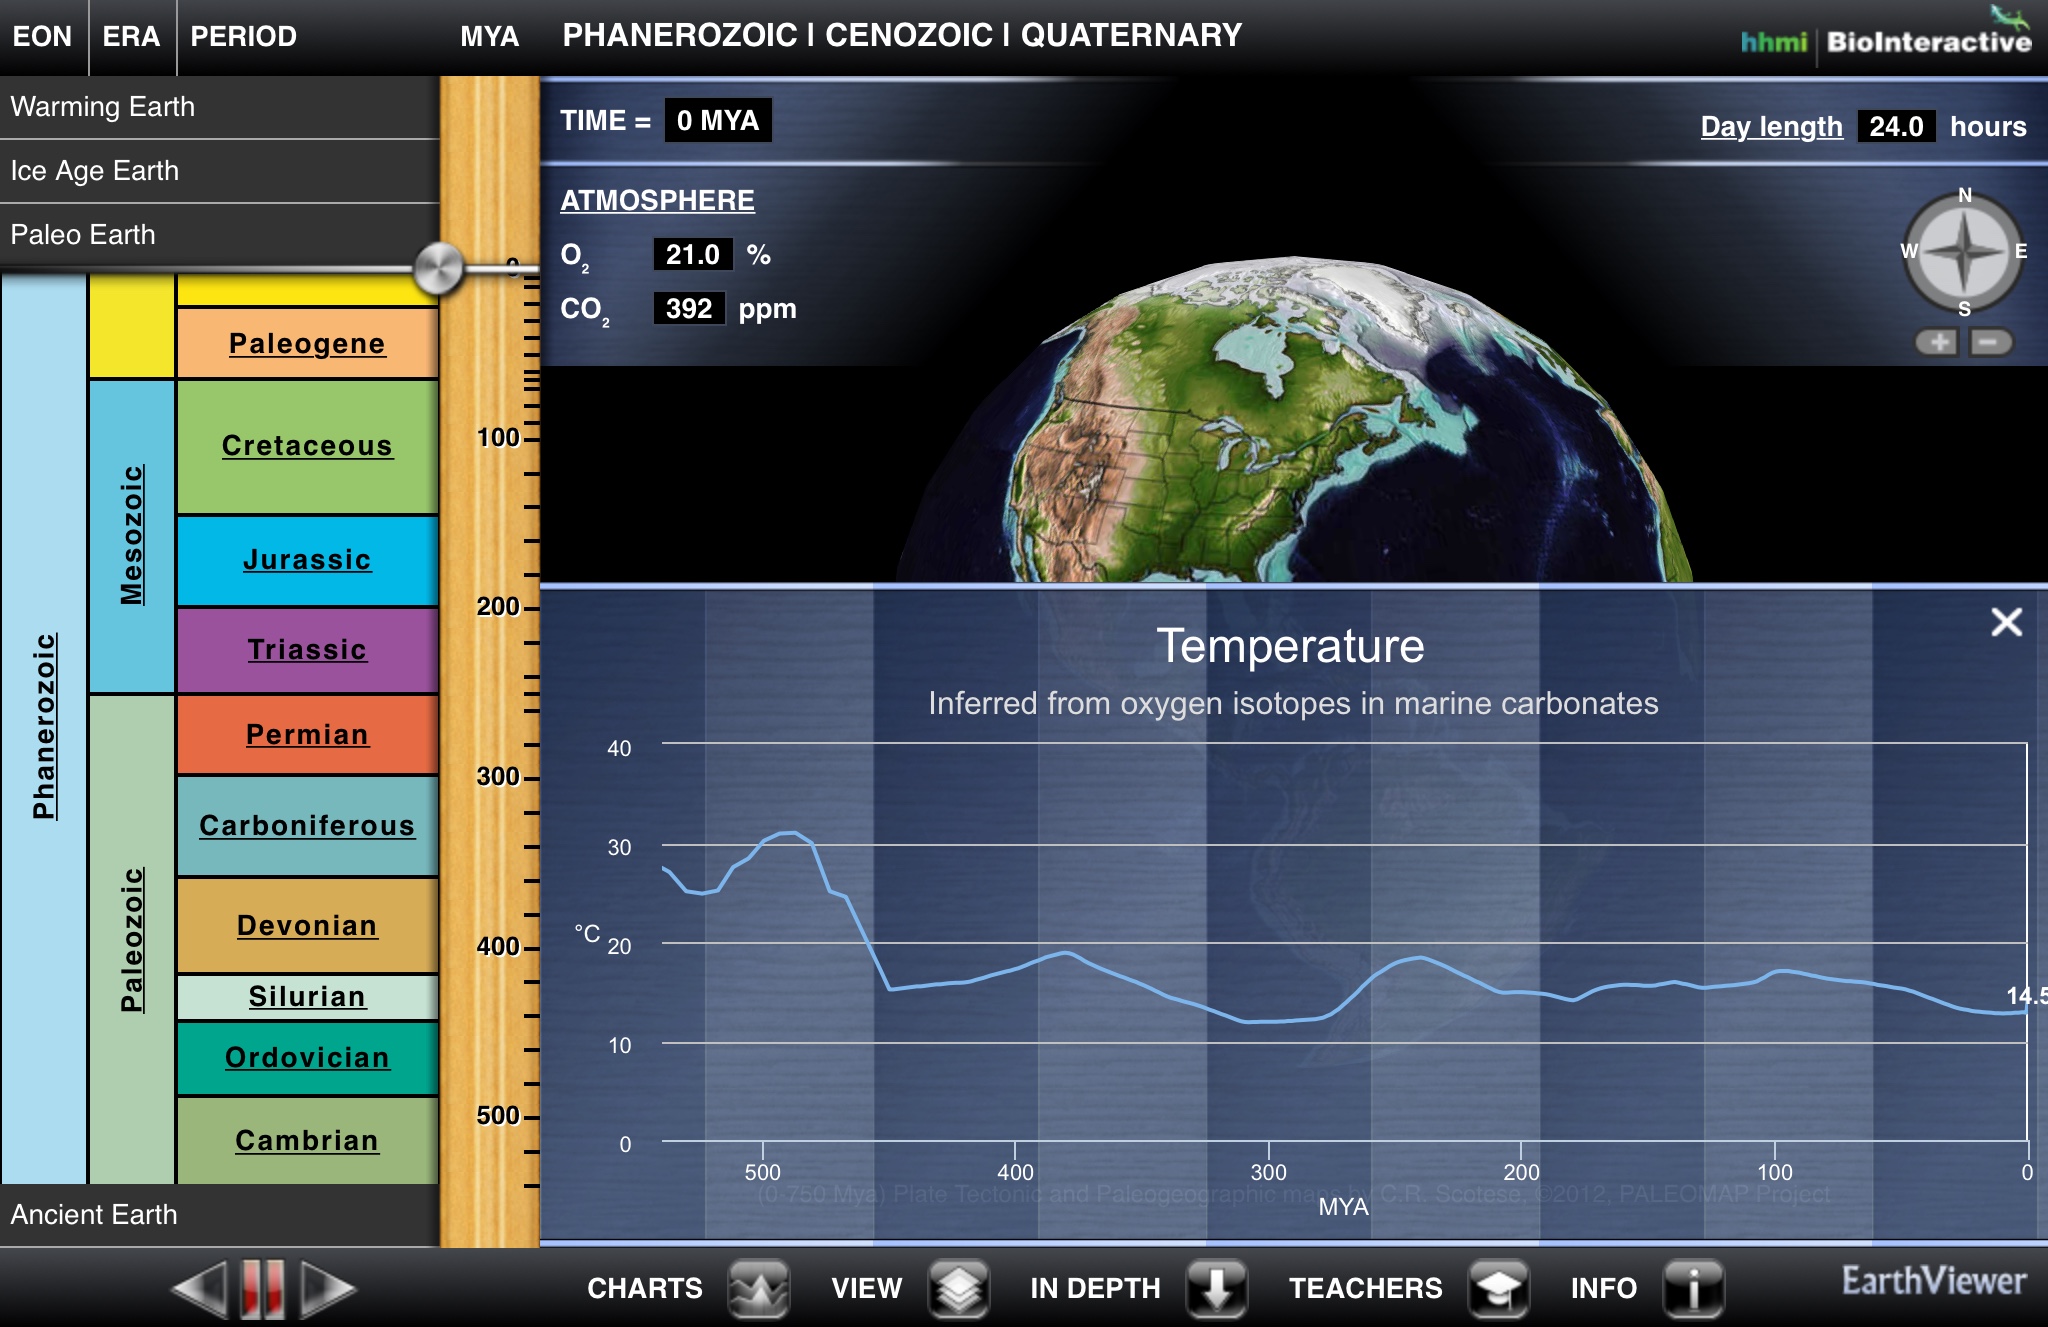
Figure 2 – EV screen showing a graph of global average temperature for the Phaneorozoic (the last 500 million years) |
Using the slider on this and the other timelines answer the following questions…
- How did the geography of the earth change during the past 550 million years?
- What is the current mean surface air temperature of the earth? To find this turn on the temperature chart. The icon for this is on the bottom of the frame in the web version, and the top right corner of the tablet version.
- When were the high and low temperatures during the Phanerozoic? To answer this give the time and magnitude of the peaks and valleys in the chart.
- Where do you see the most abrupt change in temperature? Hint you may have to resort to the “Ice Age Earth” to find this.
- Compare these temperature highs and lows to the oxygen, carbon dioxide, day length, and solar luminosity graphs. Which of these seems to show the closest relationship to temperature? Note – The mobile app version allows you to display two graphs simultaneously, the web version does not, so you have to go to the icon at the bottom of the frame to change the parameter being shown.
Activity C: Synthesis
- Earth Viewer has four time–controllers (timescales). How are these related to each other?
- The geologic record is the evidence for past events found in fossils, rocks, soils, seafloor sediment, ice, and landscapes. Based on the relationship between the four timescales you noted in question 1, what can you say about the detail of the geologic record for recent events vs. the record for ancient events?
- Why is the detail different for recent events?
- Based on your results for Activity B, how is the climate change taking place during the past 200 years different from other periods of warming or cooling during the past 550 million years.
