17: Sea Level and Coastal Flooding
Key questions for this investigation
- What are the impacts of probable changes in global sea level?
- What factors determine the severity of those impacts?
- What are the implications of these impacts for future urban development?
Tool used for this investigation
Surging Seas Risk Finder – Climate Central < https://riskfinder.climatecentral.org/ >
Background
Determining how much sea level rises or falls along coastlines is complicated by the fact that the sea surface continually fluctuates. For instance, waves and tides produce cyclic changes in the surface that vary over a period of seconds to hours. Strong storms, rapid runoff from coastal streams, and earthquakes generate localized, one time increases in sea level like storm surges, coastal flooding, and tsunamis. Finally, over a much larger and longer span, changes in the volume of the oceans result in global changes in sea level.
It is the latter that is of interest to any discussion about climate change impacts. During the past few millennia changes in global sea level were largely a product of thermal expansion of seawater and changes in planetary ice cover. The idea of thermal expansion of sea water is simply that water increases in volume as it warms. Modeling of sea level change over the past two centuries indicates that this expansion has been a major contributor to the observed rise in sea level. Though a lesser factor, diminishing ice cover is still significant since shrinking land ice (glaciers and ice caps) contributes additional water to the oceans.
A significant risk of likely global sea level rise is that around 10% of the world’s population live in coastal areas are less than 10 m above sea level, with an additional 30% loving with 100 km of the coast. Furthermore, with nearly 10% of the world’s cities being located on or near coastlines the issue of rapidly rising sea level poses a number of major development issues. Each community faces a complex mix of specific issues related to their natural setting, size, and population character. These activities are designed to look at these factors.
Investigation
Activity A – Sea Level rise impact on a Coastal City
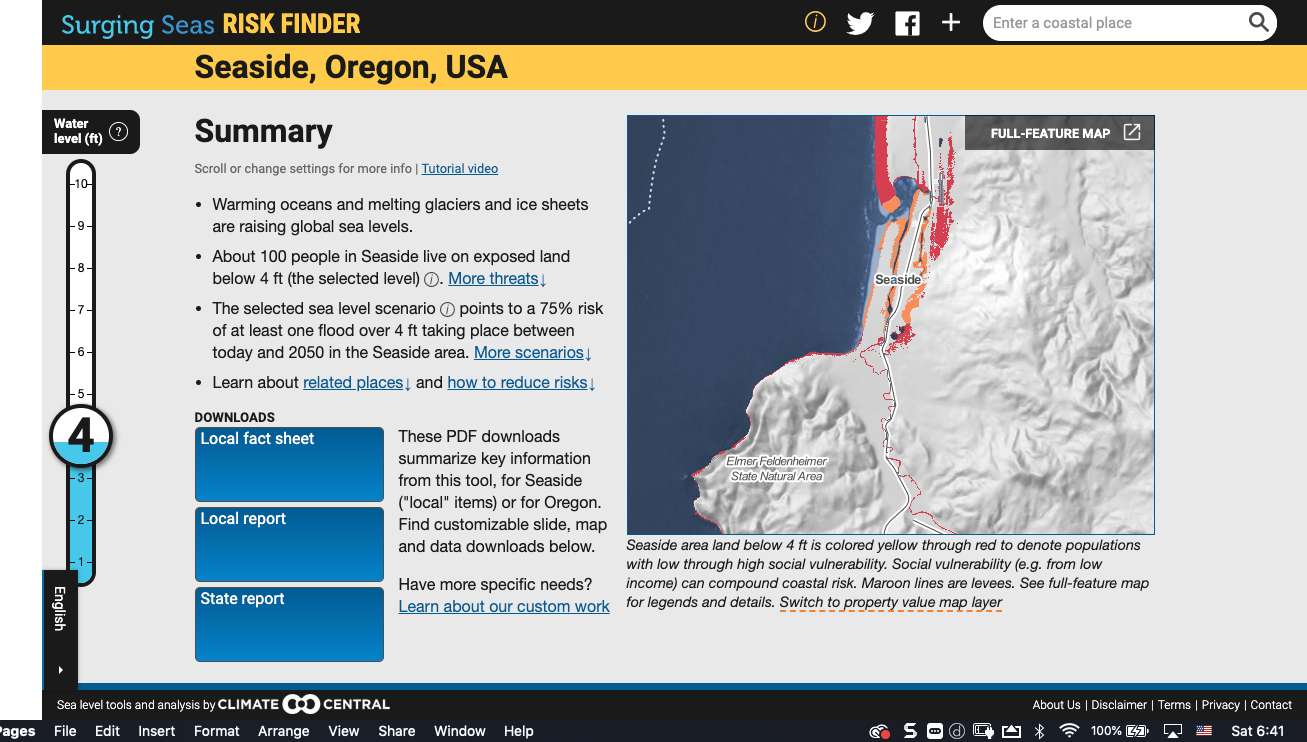
Launch the Risk Finder from your web browser < https://riskfinder.climatecentral.org/ >. Once it appears, type Seaside Oregon into the search bar in the search bar in the center of the screen. What you will see should look like Figure 1.
Seaside and sea level rise – Questions
- How would you describe the landscape of Seaside? Pay particular attention to elevation, the presence and size of areas that are flat or mountainous, where beaches, streams, and bays are.
- Find the water level indicator on the left side of the frame. Set it for 3 ft. What does this mean? To help with this question click on the question mark in the label at the top of the scale.
- Thinking of water level as projected sea level rise, which areas are affected by this rise? What physical factors determine which areas are affected?
- For a sea level rise of 3 ft how many people now live in areas that would be chronically flooded by that rise?
- For a 3 ft rise what is the probability of at least one flood exceeding this value taking place during the next 30 years (2020 to 2050)?
- Answer questions 4 and 5 for water levels of 5 and 10 feet.
 |
 |
|
Figure 1 – The Risk Finder information page that appears when you select a location. This page is for Seaside Oregon, a coastal city on the Northwest Oregon Coast. |
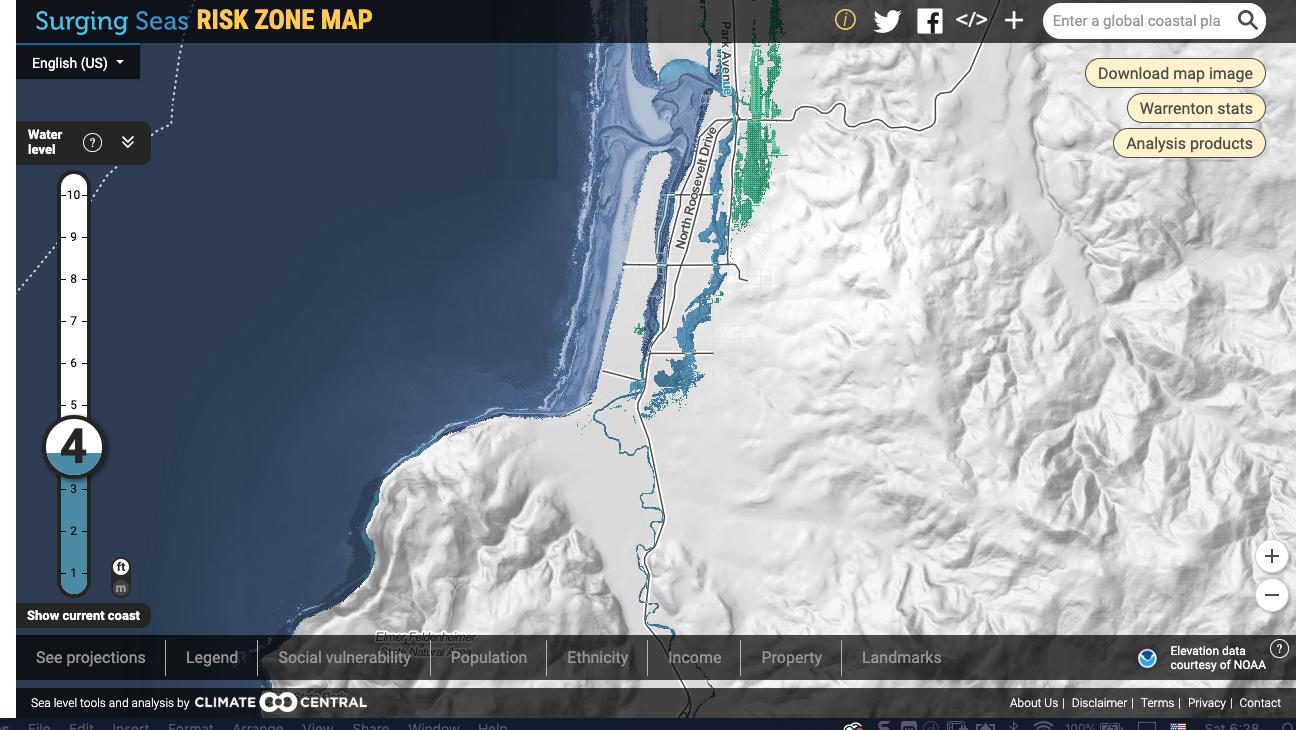
Figure 2 – Full-Feature map for Seaside Oregon. Other locations can be selected by typing them in the search window in the upper right corner of the screen. |
Click on the label “Full-Feature Map” in the upper right corner of the map near the top of the page. Doing this should open a map in a new tab in your browser that looks like Figure 2. Once you have accessed this map, set the water level indicator to 3 ft and then click on “Legend” in the display bar at the bottom of the map.
- Where are the areas that are below water level and where are the areas that are below water level but isolated? Which of these areas are not affected by rising and falling tides?
- What happens to these areas at 5 and 10 ft rises?
Reset the water level indicator to 4 and select “Social vulnerability” from the display indicator.
- Where do you find the highest and the lowest vulnerability in Seaside?
- What do you think determines vulnerability? Hint – look at the other options in the display bar.
Activity B – Comparison of two coastal cities
Return to summary page for Seaside and type “Miami, Florida, USA” into the search bar. When the page appears set the water level indicator should default to 3 ft, if it does not set it to that level.
Comparing Seaside,OR to Miami Fl – Questions
- What is the landscape of Miami like? How does this compare to that of Seaside?
- What areas in Miami would be affected by a 3 ft rise in sea level?
- What areas would be affected by 5 and 10 ft rises in sea level?
- How does the proportion of Miami impacted by a 5 and 10 ft rise in sea level compare to the proportion of Seaside that would be impacted by same rises?
- For a 3 ft rise in sea level what is the probability of a flood over 3 ft taking place during the next 30 years? How does this compare to the same probability for Seaside?
- What makes for the differences you observed between Seaside and Miami?
For this next part select the full-feature map for Miami and reset the water level indicator to 3 ft.
- Select legend from the display options bar. Where are the areas that are below water level vs. the areas that are below water level but isolated?
- What do you estimate the ratio of below water level to below isolated areas to be? How does this compare to the same ratio for Seaside?
- What happens to these areas with 5 and 10 ft rises?
- Reset the water level indicator to 3 ft and select social vulnerability. Where are the most vulnerable and the least vulnerable populations?
- How does population density, income, ethnicity, and property values determine social vulnerability?
- How do these factors for Miami compare to that of Seaside?
- Which of the two cities would seem to be the most impacted by sea level rises of 5 and 10 ft and why?
Activity C – Sea level rise impact on an inland city
For this part of the activity, select Portland, Oregon. Portland is an inland city which would seem to be immune to the rising sea level. The goal of this activity is to see if this assumption is accurate. Once you have arrived at the summary page for Portland set the water level indicator to 3 ft.
Portland and sea level rise – Questions
- What is the landscape of Portland like?
- Referring to the map on the right where are the areas likely affected by a 3 ft rise in sea level?
- What additional areas would be impacted with 5 and 10 ft rise in sea level?
- Given a 3 ft rise in sea level what is the probability of at least one flood over 3 ft taking place in the next 30 years?
- For the next questions select the full-feature map and set the water level indicator for 3 ft.
- Which areas are below water level vs. which are below water level but isolated?
- What happens to these areas with a 5 and 10 ft sea level rise?
Activity D – Synthesis
Questions
- Rank Seaside, Miami, and Portland in terms of their vulnerability to rising sea level.
- What are the physical and social factors you used to make your ranking?
- Which of these factors were most significant for each of the cities?
- For each of the three cities propose at least two specific strategies that they could develop that would help them adapt to 9 ft rise in sea level deemed probable under the Business as Usual scenario outlined by the IPCC in one of their recent climate assessments.
