19: Climate and Streamflow
Key questions for this investigation
- How does streamflow vary during the year?
- What factors determine how it varies?
- What impact does increasing regional temperature have on streamflow?
Tool used for this investigation
- Future Streamflow Tool <https://climatetoolbox.org/tool/Future-Streamflows > from the Climate Toolbox – University of California Merced < https://climatetoolbox.org/ >
Background
One of the resources impacted by current climate changes is water. In particular, streams and their watersheds will likely change dramatically as regional climate (largely precipitation and temperature) changes in predicted ways. This activity is designed to help you investigate what those impacts might be for selected watershed. To prepare you to do this here are some key concepts.
Watershed – A defined area that acts like a funnel to capture precipitation and direct it downhill into the ocean or a landlocked lake. Watersheds consist of their upper reaches; there rain or snowmelt drains into small streams that then merge to form even larger streams before joining in the lower reaches to form rivers that course over the floor of a central valley.
Stream gauge station – A measuring station located on a strategic location on a stream to determine stream velocity and discharge (the amount of water passing through the stream at that spot over a given time period).
Hydrograph – A graph showing discharge as a function of time. In the following activities you’ll be looking at graphs showing monthly discharge averaged over multiple years. The graphs will do this both for historical records and for currently projected climate changes.
Water resources – Water from streams and aquifers (underground water) available for irrigation, manufacturing, and consumption. One of the tricks about managing water resources is providing for these needs while ensuring that enough water remains in a watershed to provide for the needs of its natural inhabitants (e.g. plants and animals).
Investigation
Activity A – Historic and projected streamflow for the Willamette River
Launch the Future Streamflows Tool in your web browser <https://climatetoolbox.org/tool/Future-Streamflows >. When the page loads it will ask you if you want to take a tour of the tool or go right to it. To simplify this activity, select “Go to the Tool”. What you see should look like figure 1.
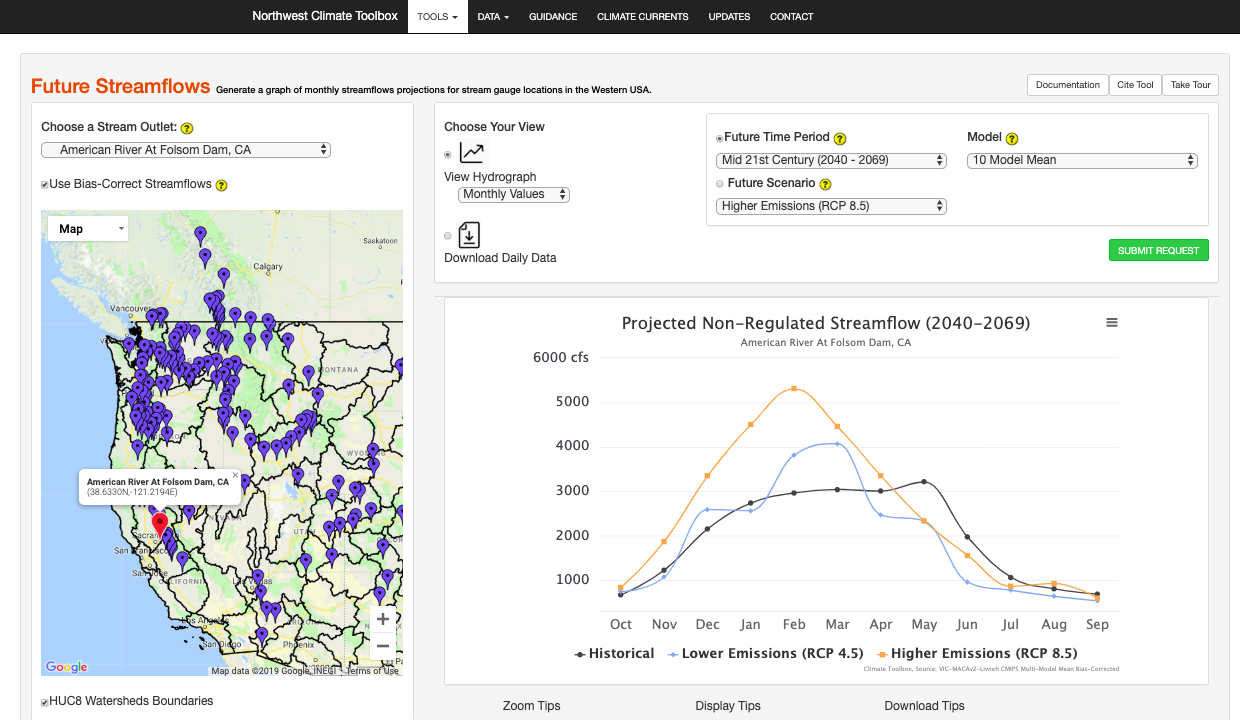 |
Figure 1Default screen for the Future Streamflows tool.The map defaults to historical and projected annual streamflow for the American River at Folsom Dam. |
Begin by selecting a gauging station on the Willamette River in Portland Oregon. To do this click on the pull-down menu above the map on the left side of the screen. From the list select the “Willamette River at T.W. Sullivan, OR” and click on the green “Submit Request” button.
Having done this turn your attention to the graph of streamflow on the right side of the frame. The vertical axis of the graph is in cubic feet per second (cfs), while the horizontal axis is month. The graph is showing historic long-term average monthly streamflow (the black line) and projected monthly streamflow for the early, middle, and late 21st century. It is showing the latter for both low and high emissions scenario.
Historical average flow – Questions
- In which month is streamflow highest for the year? What is it in cfs?
- In which month is it lowest? What is the average flow for the month?
- During what seasons is stream flow decreasing, when it is increasing?
Now focus on projected changes in streamflow. To do this set the future time period to the late 21st century (2070-2099). This can be done using the pull-down menu above the graph that has this same title.
Changes in flow – Questions
- Answer questions 1-3 for both the RCP 4.5 and 8.5 scenarios?
- Is there any change in the timing of the highest and lowest flow months?
- For each projection what is the difference between the projected highs and lows and the historic high and low flows?
Activity B – Historic and projected streamflow for the Skagit River
For this part of the activity switch the gauging station to the Skagit River at Ross, WA. Make sure that the future time period is set for the late 21st century and then click on the green “Submit Request” button.
Questions
- For the historic averages which month has the highest flow? Which month has the lowest flow? What is the average flow during each month?
- When is there a second lower peak in the curve that is lower than the one you identified in question 1? What is the average flow during that month?
- When is there a second low that is higher than the one you identified in question 1? What is the average flow during that month?
- Looking at the two peaks in historical average curve, is there any change in timing in either the RCP 4.5 or 8.5 curves?
- What is the difference between each of the peaks in historical curve and the two projected curves in cfs?
- Are there any differences in timing between lows in the historical curve and the two projected curves?
- What are the differences between these lows in cfs?
Activity C – Comparison of change in two watersheds
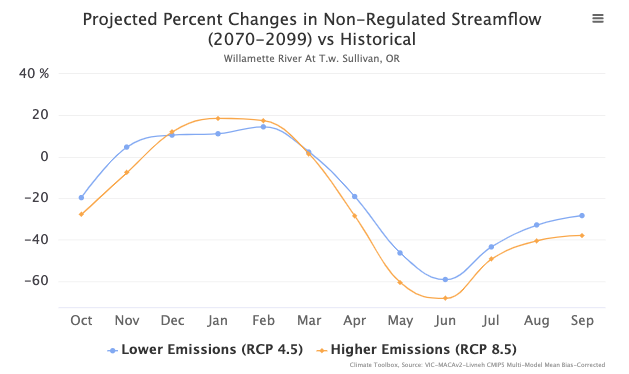
For this last part you will look at the timing and % percent change in average monthly streamflow for both of the watersheds you just examined. Select the Willamette River at T.W. Sullivan Oregon from the stream outlet menu. Then select the late 21st century as the Future Time Period and click on “Submit Request”. The graph you get when you do this should look like figure 2.
|
|
Figure 2Graph of projected change in average monthly streamflow for the Willamette Valley gauging station at T.w. Sullivan, Oregon. |
Comparing watersheds – Questions
- Which months showed the largest decrease? How much less is it for each projection?For each of the two projections which month shows the largest increase in streamflow? How much larger is it?
- Are there any months that showed little or no decrease?
Now switch over the Skagit River at Ross Lake WA and answer questions 1 and 2 for this station. For record keeping purposes record your answers as 3 and 4
Activity D – Synthesis / Reflection
Here is some additional background to help with this synthesis.
Willamette Valley:
Bounded on the east by the Cascade Range and to the east by the Coast Range, the Willamette River flows north through a broad valley before merging with the Columbia River. It drains more than 29,784 sq km (11,500 sq mi) and descends from elevations of up to 10,000 feet down to nearly sea level. The temperate climate and low elevation of much of the watershed means that summers tend to be hot, dry, and generally cloudless, while the winters tend to be cool and wet. While the surrounding mountains can receive significant snowfall during the winter, much of these highlands tend to be snow free by late spring or mid-summer. The exception to this is the High Cascade region which has a number of large volcanic peaks that rise to as much as 3350 m (11,000 ft). Many of these have glaciers and perennial snowfields where ice survives throughout the year, though with rising regional temperatures the volume of this ice has been decreasing significantly over the past two centuries.
Skagit River Valley:
The Skagit River watershed is located in the North Cascades of northern Washington State and southern British Columbia. It drains an area of nearly 6900 sq km (2664 sq mi). Unlike the Willamette Valley, the Skagit Valley is a narrow, deep trough carved into heavily glaciated, mountainous terrain. The seasons in the lower parts of the watershed tend to be similar to that of the Willamette Valley, with hot, dry summers and cool, rainy winters. However, the higher parts of the watershed tend to be much colder and snowier. This means that a higher percentage of the watershed remains covered with glaciers and snow for much of the year. Consequently, melting snow and ice supply water to area streams throughout the summer. However, like the Cascade Mountains the percentage of the highlands covered in ice has diminished rapidly in response to warmer winters and hotter drier summers.
Consider this background as you answer the following questions.
- Why do the Willamette and Skagit Rivers have the peak flows when they do during the year?
- Why does the timing and magnitude of the two peak flows for the Skagit at the end of the 21st century shift like they do under both emission scenarios (RCP 4.5 and 8.5)?
- What is the implication of the changes in winter streamflow for future flooding in the lower reaches of the valleys?
- How might changes in winter streamflow affect the frequency and magnitude of landslides along the valley walls?
- What is the implication of the changes in summer streamflow for agriculture in the Willamette and Skagit Valleys?
