Appendix A: Tools used in this Manual
This appendix contains descriptions of the on-line climate models, climate data viewers, interactive atlases, and other web-based resources used in the activities in this manual.
|
|
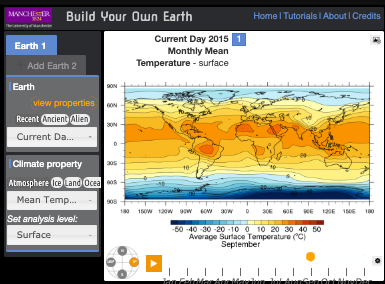
Build Your Own Earth BYOE uses the Fast Atmosphere-Ocean Model (FOAM), a climate model run on supercomputers to understand climate dynamics. Able to model past, present, and future climate conditions, this web-based data portal was developed the University of Manchester. |
||
|
|
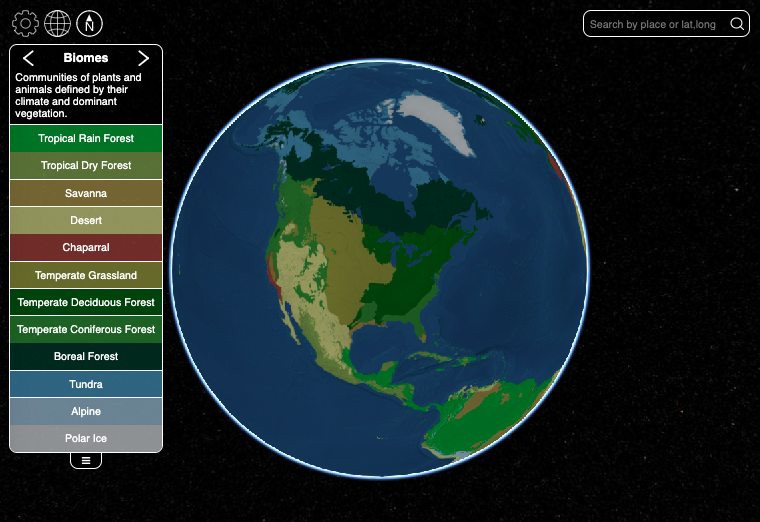
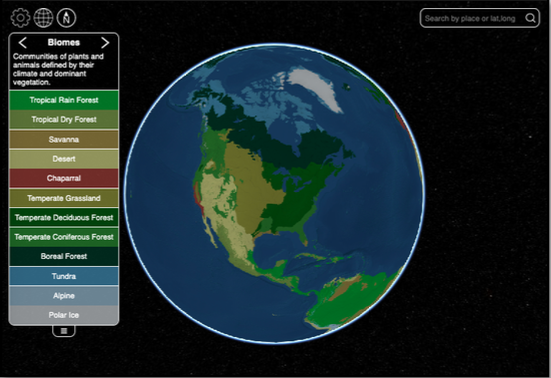
Biome Viewer Biome viewer is an interactive atlas that shows major biomes (plant and animal communities), changes in human development over the past 3 centuries, average annual temperature and precipitation across the globe, and the plants and animals inhabiting the major biomes. Biome Viewer was developed by the Biointeractive Group at the Howard Hughes Medical Institute. |
||
|
|
C-Roads C-Roads is a climate simulator developed to accompany the World Climate Simulation. Both were developed by Climate Interactive to help students and other citizens understand the issues involved in the UN Climate Negotiations. C-Roads is a simple climate model that forecasts changes in average global temperature. |
|
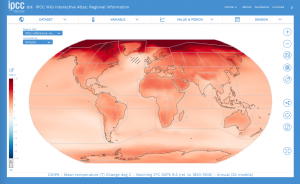
WG1 Interactive Atlas This tool accompanying the 2021 IPCC Working Group 1 Sixth Assessment Report. Its purpose is to provide an interactive medium for analyzing the observed and projected climate change information contained in the report, and do so on a regional level. This Atlas was produced by the IPCC |
|
|
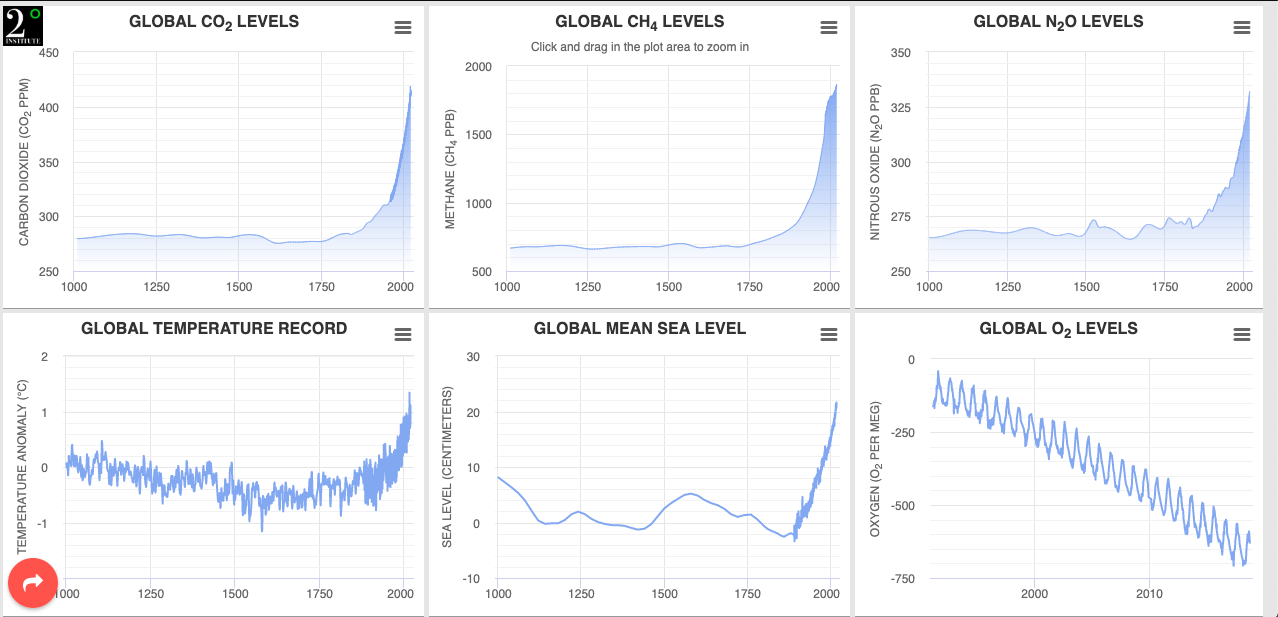
https://www.climatelevels.org/?pid=2degreesinstitute&theme=grid-light |
Climate Dashboard The dashboard is a series of interactive graphs showing changes in global temperature, sea level, and CO2, CH4, N2O, and O2 levels over the past 1000 and 800,000 years. The Dashboard was produced by 2° institute. |
|
|
|
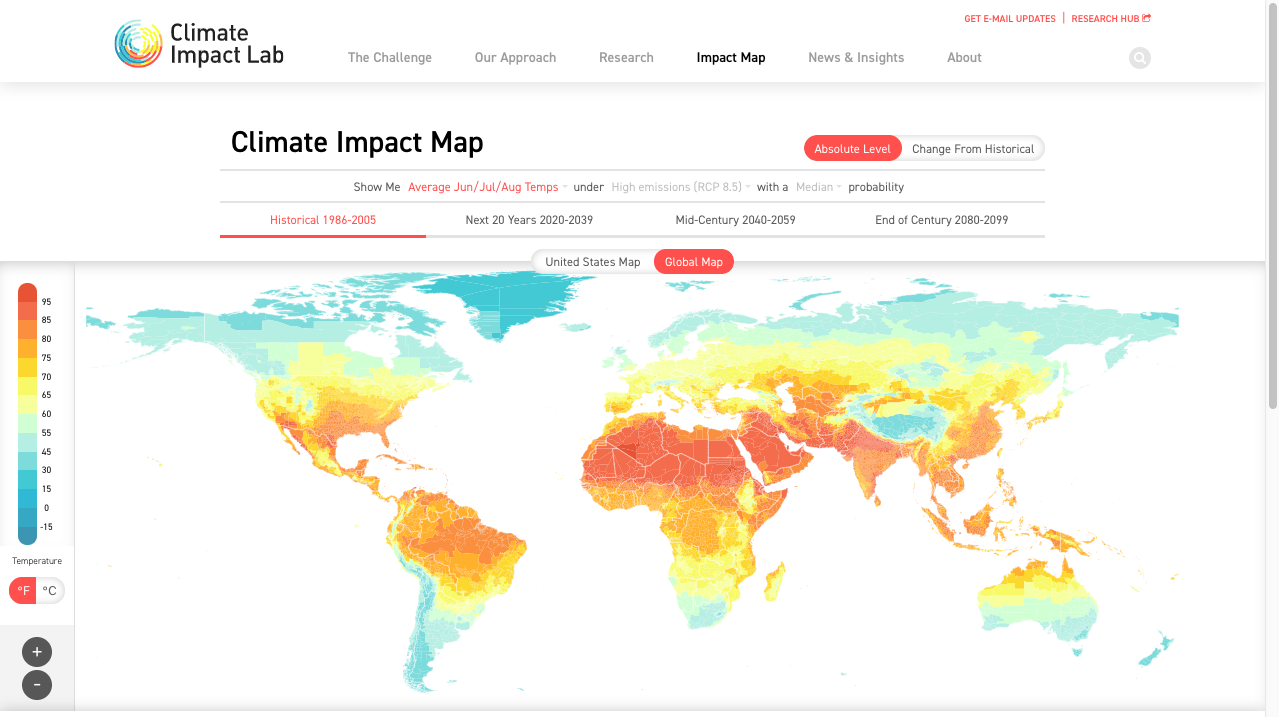
Climate Impacts Map CIM is a viewer for climate model data that shows probable changes in average annual and seasonal temperature for individual countries and states up to 2100. CIM was developed by the Climate Impacts Lab (a coalition of researchers). |
|
|
|
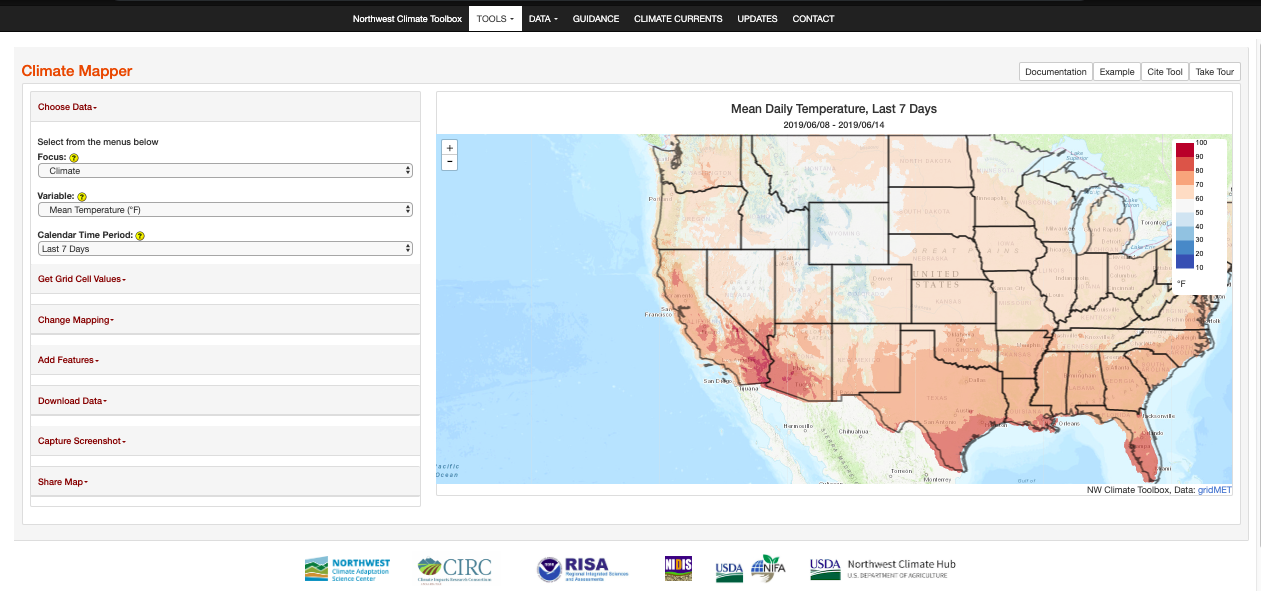
Climate Mapper (NCT) Climate mapper is part of a suite of tools called the Northwest Climate Toolbox. Mapper is an interactive map of the United States that displays recent climate changes related to water resources, agriculture, and fire danger. The Toolbox was developed by the Applied Climate Science Lab at the University of Idaho |
|
|
|
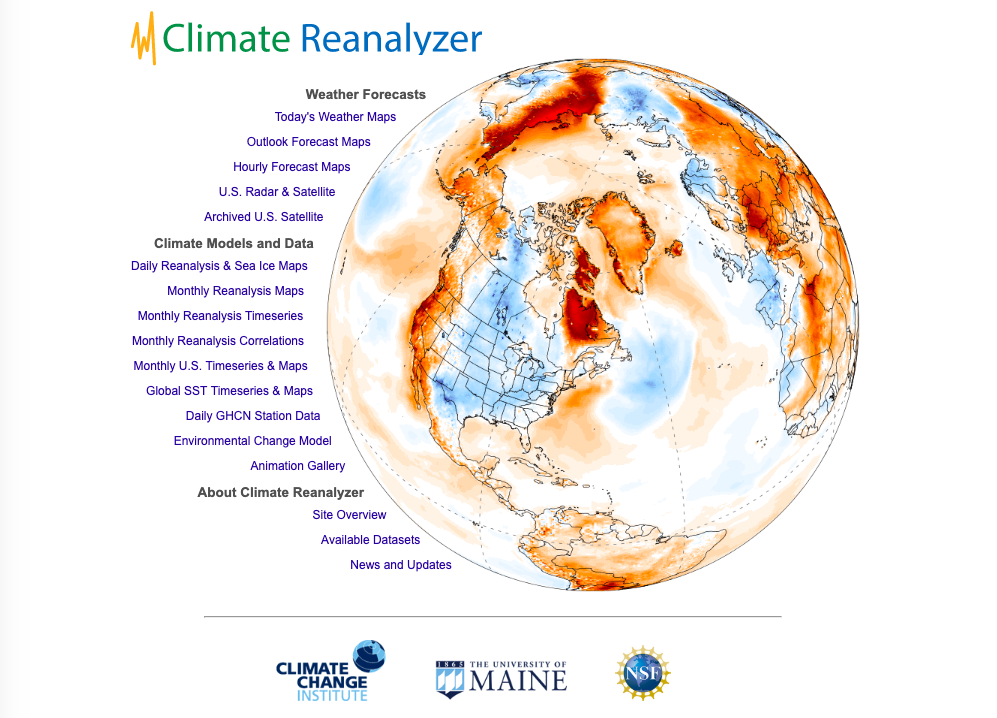
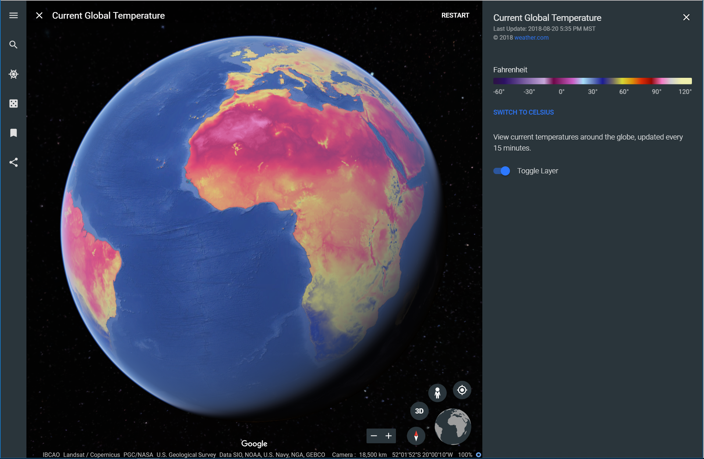
Climate Reanalyzer Climate Reanalyzer is suite of weather and climate datasets developed by the Climate Change Institute at the University of Maine. The suite includes weather forecasts and a variety of climate models and data sets. A good starting place for understanding the difference between weather and climate. |
|
|
|
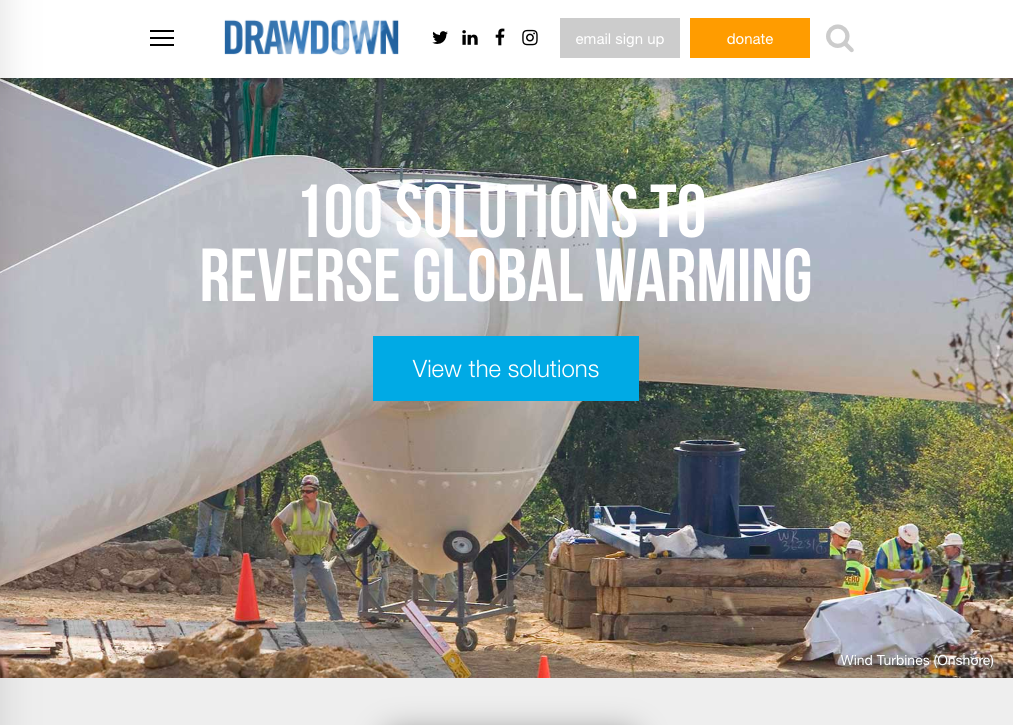
Drawdown Solutions The Drawdown project is a coalition of researchers, students, business leaders and activists seeking to provide the best available information on solutions that could be implemented over the next thirty years to keep climate change to safe levels. The solutions catalog is a listing of their top 100 strategies. |
|
|
|
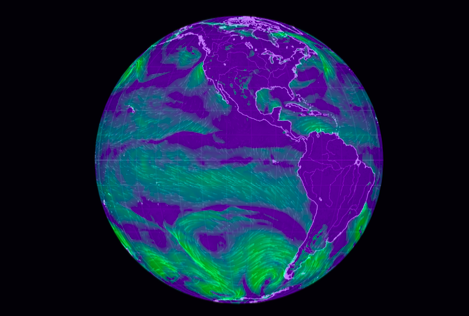
Earth An animated map of real-time and archived winds, ocean currents, and atmosphere and ocean physical properties. Created by a web developer, Cameron Beccario, Earth uses data from the Global Forecast System to produce the maps in the viewer.
|
|
|
|
Earth Viewer Earth Viewer is an interactive atlas of the world that displays how geography, climate, and biology have changed over the planet’s 4.5-billion-year history. The atlas was developed by the Biointeractive group at the Howard Hughes Medical Institute. |
|
|
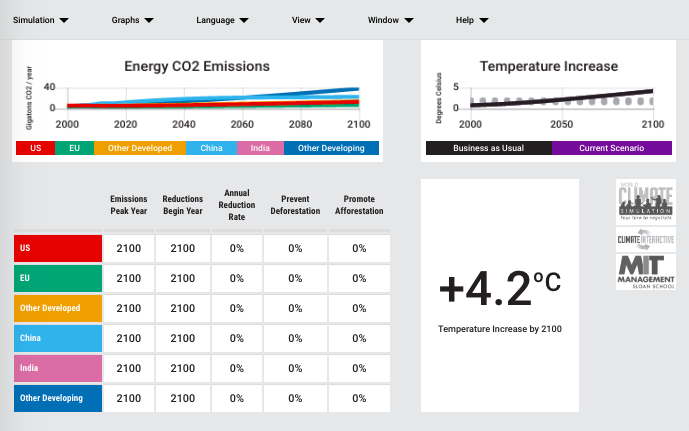
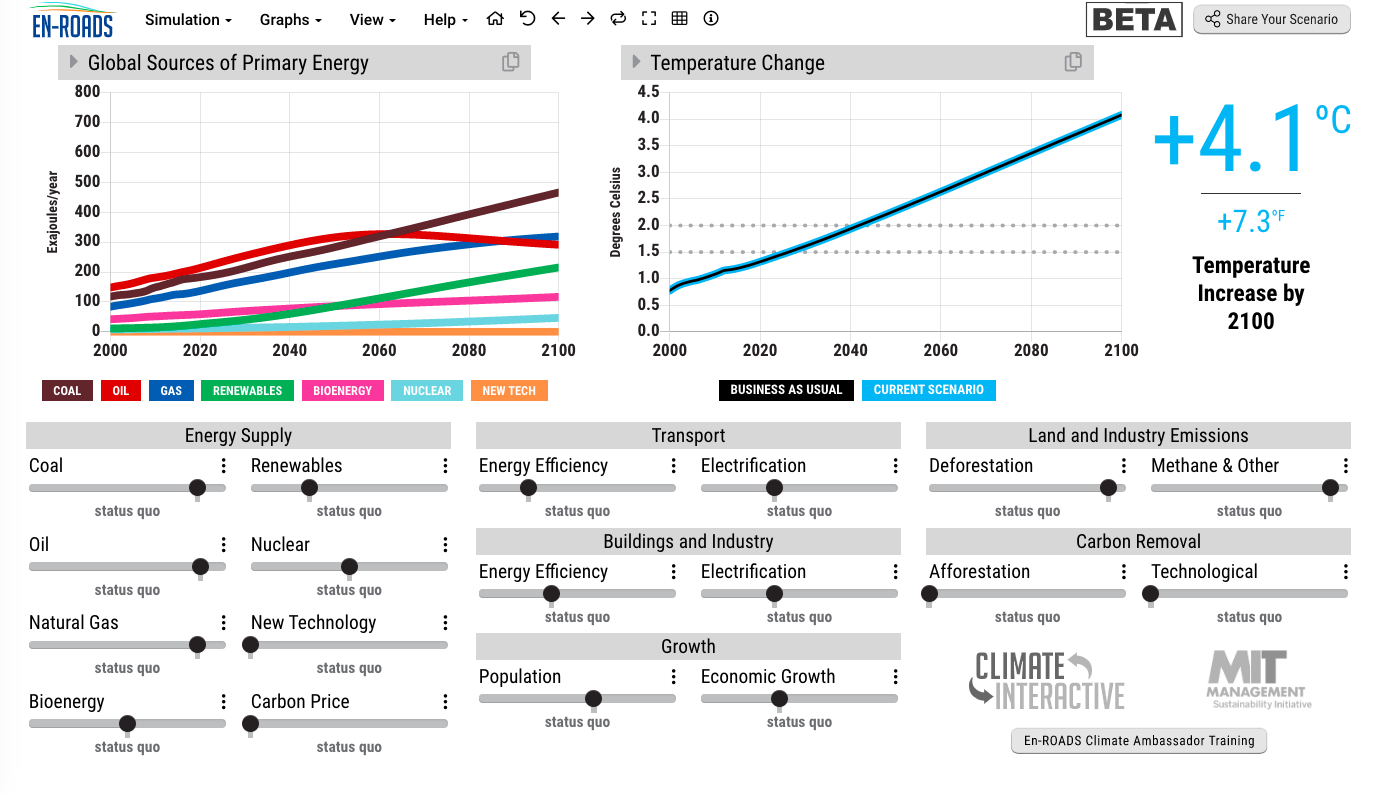
https://en-roads.climateinteractive.org/scenario.html?v=2.7.6 |
En-Roads En-Roads is an energy-environment simulator developed by Climate Interactive. The simulator allows users to select fuels to power global civilization, adjust global energy efficiency, and select levels and types of sequestration to employ. Like C-Roads the simulator is designed to investigate what it would take meet the Paris 2015 temperature targets. |
|
|
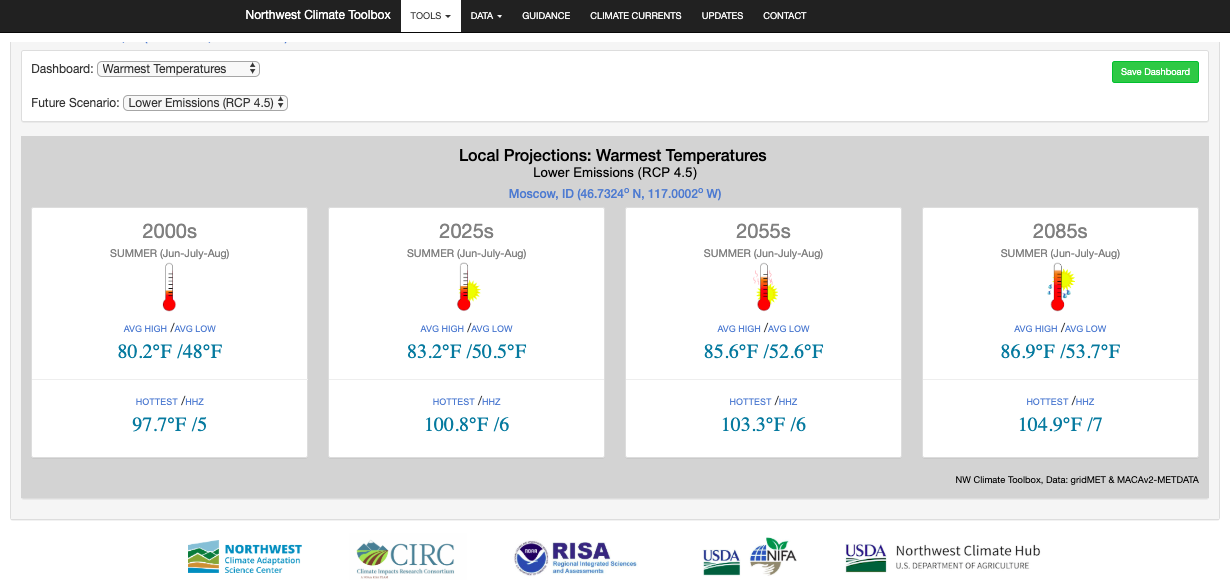
Future Climate Dashboard The Dashboard is part of a suite of tools called the Northwest Climate Toolbox. It is built to show projected warmest and coolest temperature, precipitation, fire danger, and growing seasons for individual cities. Projections are for now through the late 21st century and are based on low and high emission scenarios. |
|
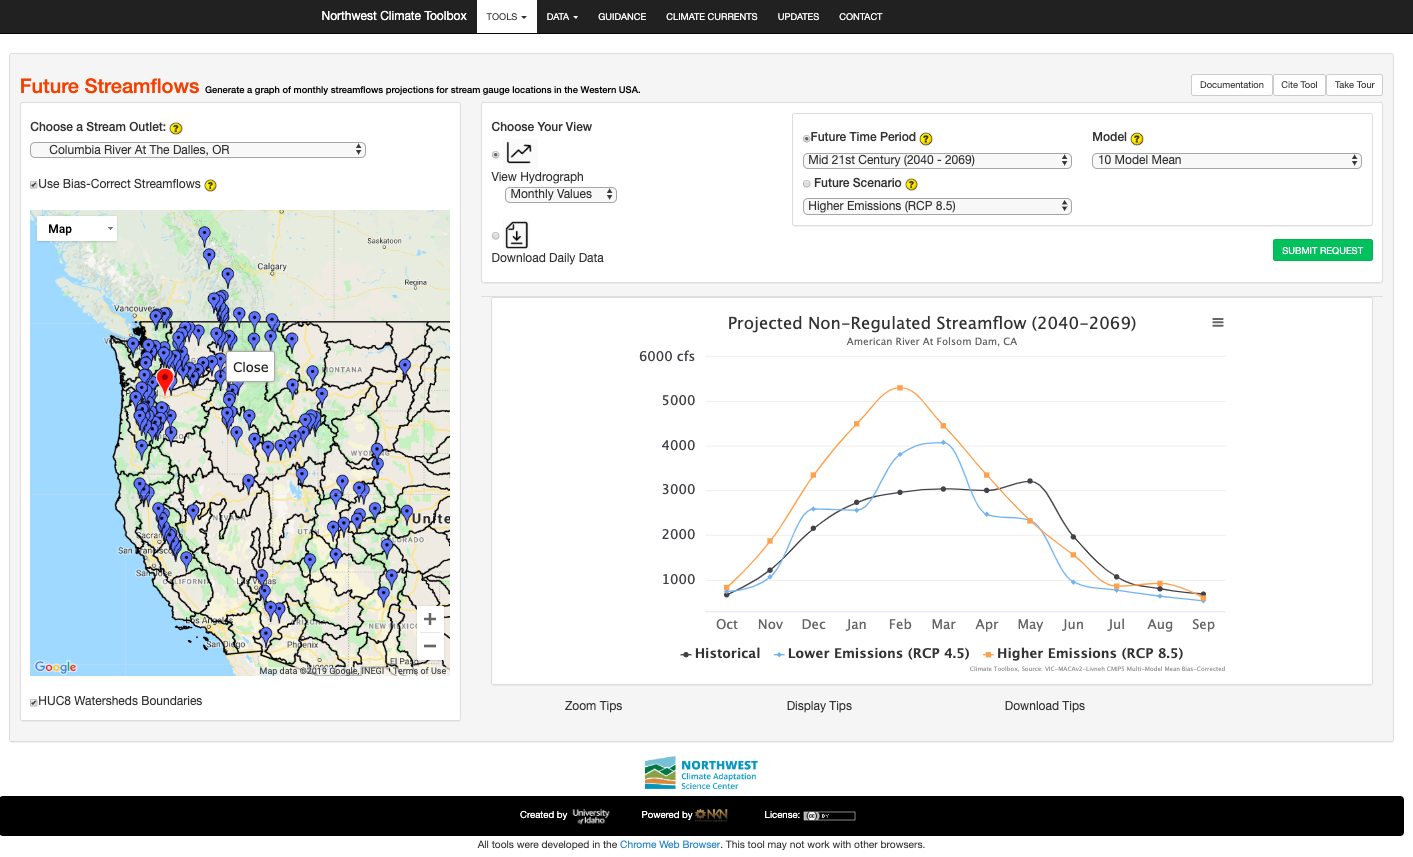
https://climatetoolbox.org/tool/Future-Streamflow-Projections |
Future Stream Flow Future Stream Flow is part of the Northwest Climate Toolbox and was designed to show changes in annual stream flow for the early, middle, and late 21st century based on low and high emission scenarios. |
|
|
Google Earth The mainstay of earth information viewers. The in-browser version used in this manual has tools for making virtual tours of selected sites. The more advanced “Pro” version allows users to do extensive measurements and overlay a variety of information produced by geographic information systems. |
|
|
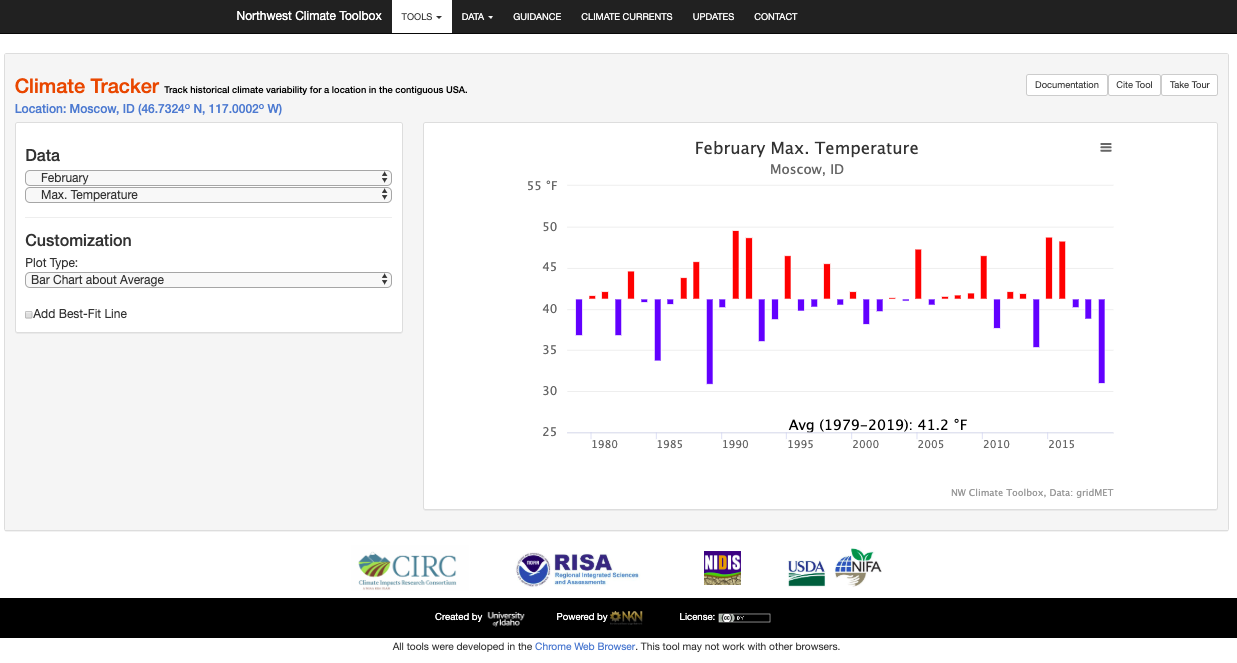
Historical Climate Mapper The mapper is a component of the Northwest Climate Toolbox developed by the Northwest Climate Adaption Science Center. It is designed to show monthly, seasonal, and yearly temperature, precipitation, humidity, and wind for selected locations. |
|
|
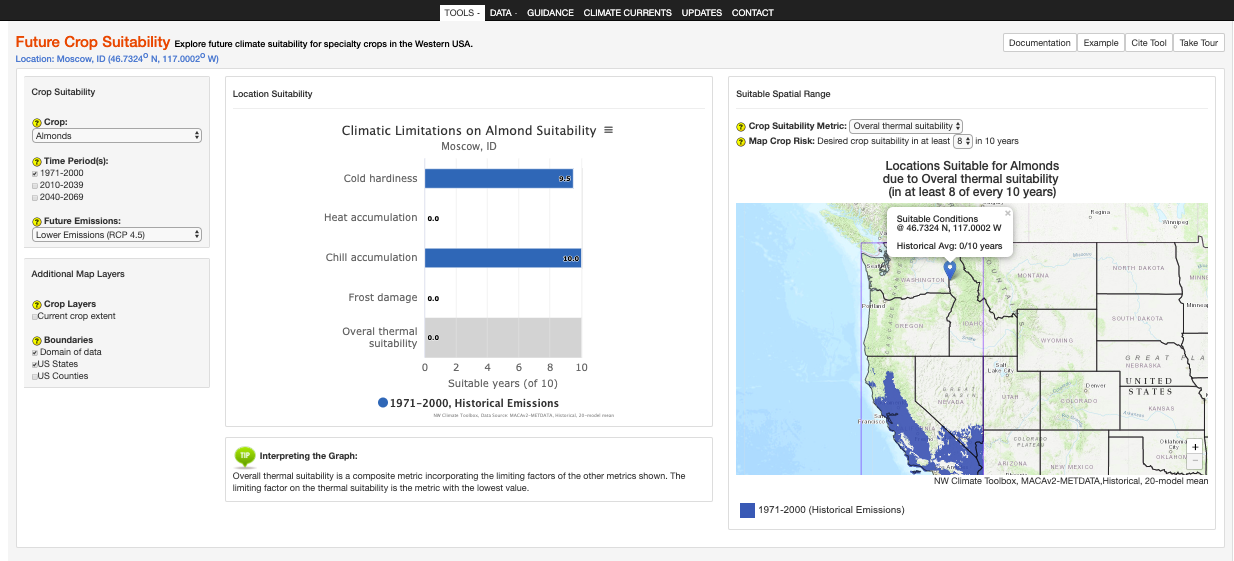
Future Crop Suitability This is another part of the Northwest Climate Toolbox. This component shows the suitability of four key crops in selected areas given projected temperature increases during the early and late 21st century. |
|
|
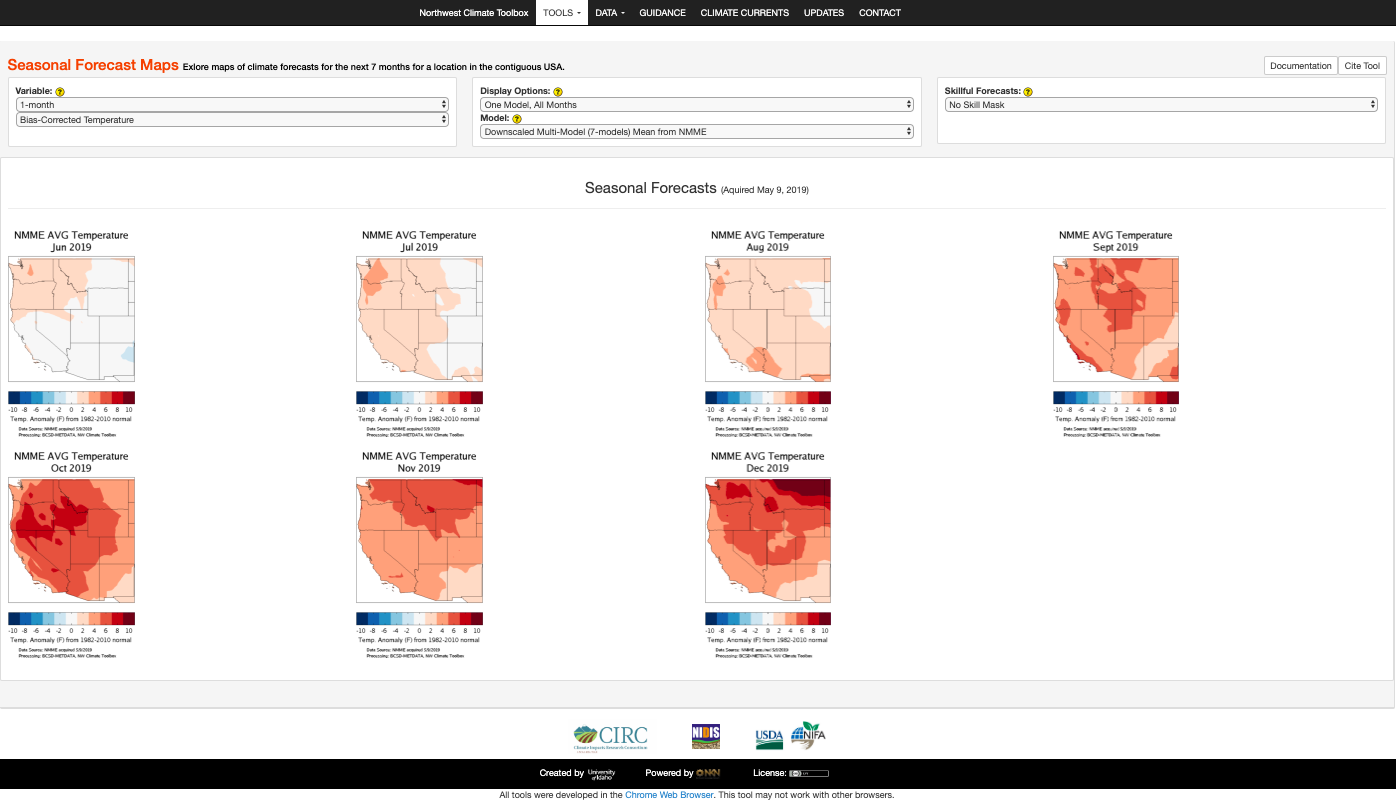
Seasonal Forecast Maps A component of the Northwest Climate Toolbox. This one is a set of seasonal forecast maps for the western United States. Forecasted elements include temperature and precipitation. Useful for seeing if a seasonal will be warmer, cooler, drier, or wetter than normal. |
|
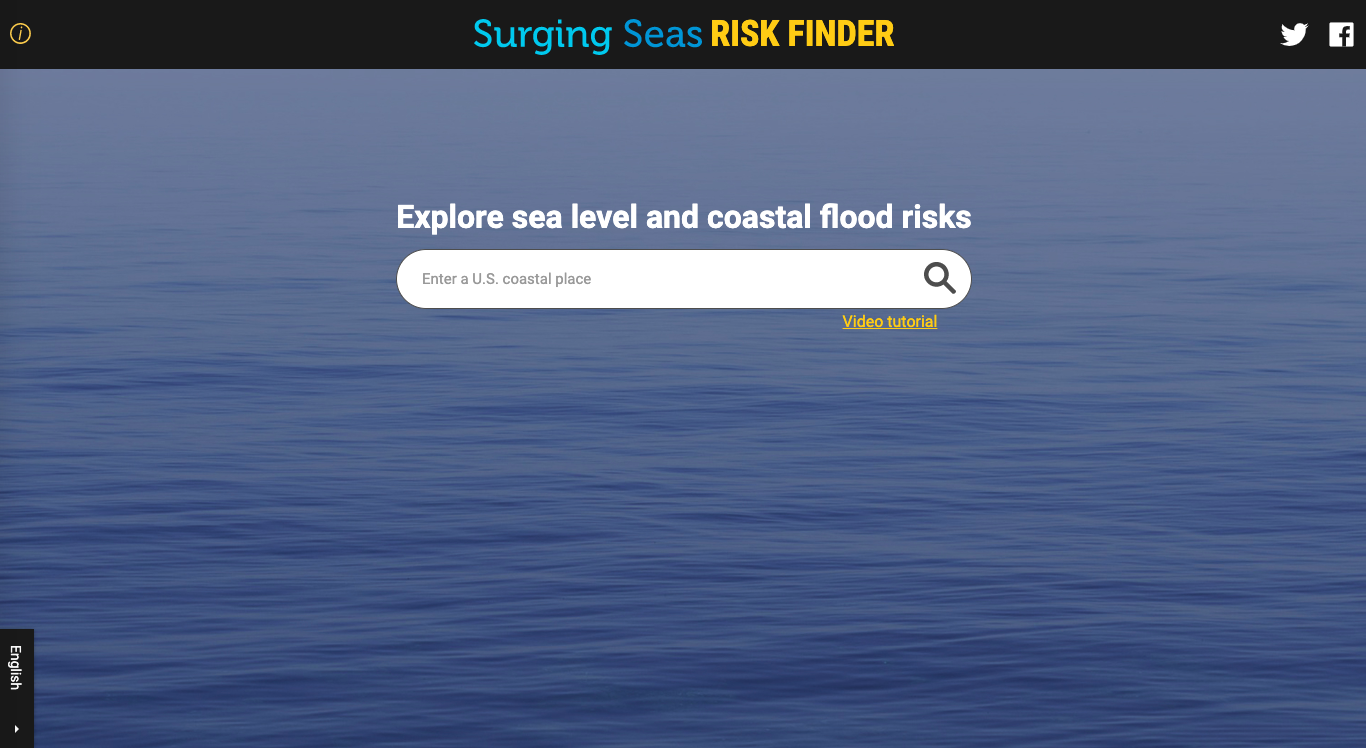
https://riskfinder.climatecentral.org/
|
Surging Seas Risk Finder An interactive map of coastal areas in the United States used for determining the amount of flooding in these areas resulting from various increases in sea level (0.5 to 30 m). This Risk Finder was developed by Climate Central’s program on Sea Level Rise |