13: Hothouse / Icehouse
Key questions for this investigation
- What is the range of climate change that has taken place on this planet?
- What factors have driven that change?
- How have sea level and global ice been impacted by these changes?
Tool used in this investigation
- Earth Viewer < http://media.hhmi.org/biointeractive/earthviewer_web/earthviewer.html > from the Biointeractive program at the Howard Huges Medical Institute
Background
An old adage is that the only constant in the universe is change. The bulk of the evidence available to paleoclimatologists (researchers who study past climate) indicates that this is certainly true when it comes to climate history. In general, this history alternates between cold, dry periods referred to as icehouse and much warmer, wetter periods called hothouse.
During icehouse episodes annual average global temperature falls enough that global ice (glaciers, sea ice, tundra, and ice caps) expands significantly. During hothouse episodes annual average temperature rises sufficiently that global ice becomes negligible or even disappears. One of the goals of the following activities is investigate what other changes take place during these episodes.
Another goal of the following activities is to examine what causes these episodes. Key factors that appear in Earth Viewer that you will experiment with include the following…
- Geography – The location and shape of the continents.
- CO2 – The amount of carbon dioxide in the atmosphere in ppm (parts per million)
- Solar luminosity – The amount of energy received by the earth.
- Impacts – Asteroid or large meteorite collisions.
Investigation
Activity A – Hothouse / Icehouse Episodes
Begin by launching Earth Viewer < http://www.hhmi.org/biointeractive/earthviewer >. When the viewer appears set its timescale to “Ancient Earth”. Next display the temperature graph by clicking on the charts button. This is located in the upper right corner of the mobile app version and lower left quadrant of the web version. Finally use the timeline to answer the following questions…
- During the past 4.5 billion years when were the high temperature peaks and what was the average global temperature at those peaks? These points on the graph represent the height of Hothouse episodes.
- During the past 4.5 billion when were the low temperature valleys? These represent the depth of Icehouse episodes.
- What is the fastest and slowest rate of temperature change during past 4.5 billion years? To do this find adjacent Hothouse peaks and Icehouse valleys. Determine the temperature and the time difference between the two. The rate of change is the temperature difference divided by the time difference in °C per year.
- Change the timescale from “Ancient Earth” to “Paleo Earth”. Repeat questions 1, 2, and 3 for the past 550 million years.
- Set the time scale to “Ice Age Earth” and calculate the rate of temperature change from 20,000 to 8,000 years ago, 4,000 to 800 years ago, 800 to 200 years ago, and 200 years ago to present (Time = 0). How do these rates compare to each other and those you calculated in questions 3 and 4?
- Calculate the rate of temperature change modeled for the next century. How does it compare to all the other rates you calculated?
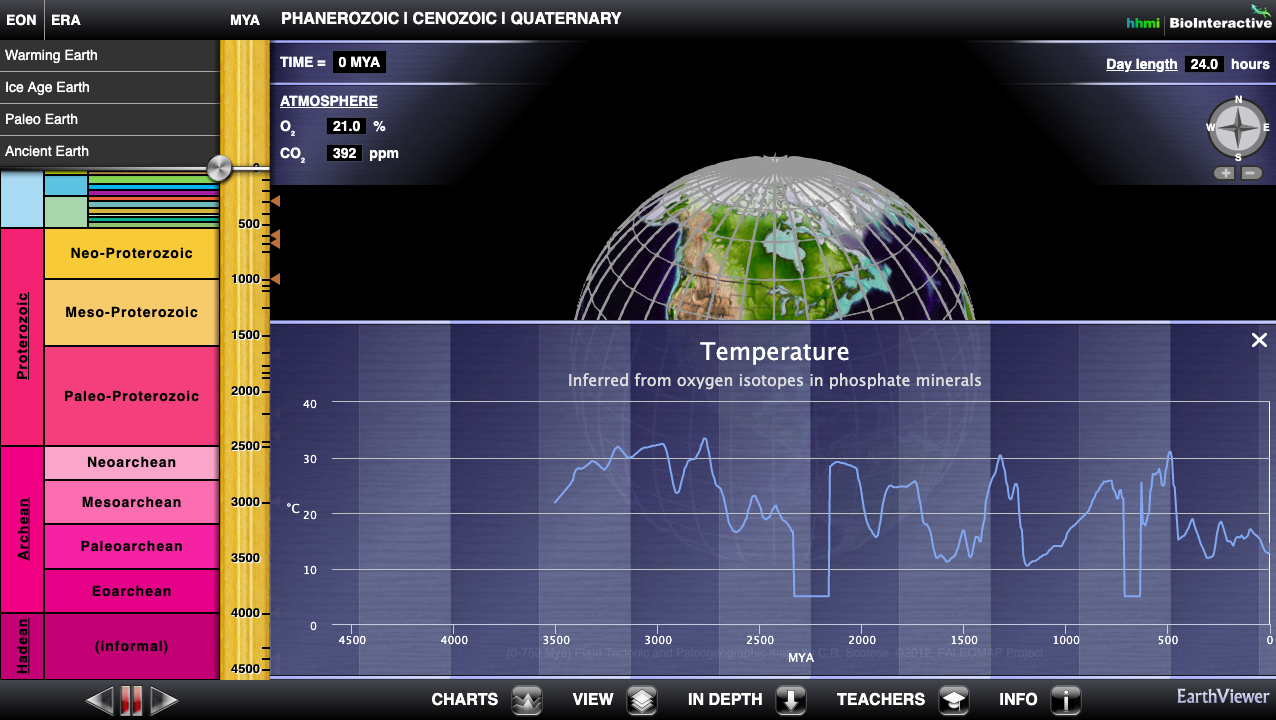 |
Figure 1 – Earth Viewer with the calendar set to “Ancient Earth” showing the earth’s entire 4.5-billion-year timeline. A graph of average global temperature is overlain onto the globe. This graph can be accessed by selecting “Temperature” from the “Charts” menu at the bottom of the screen. |
Activity B – Climate forcings and feedback
Set the calendar to “Ancient Earth”. Using the slider on this and the other timelines answer the following questions…
- For each of the hothouse episodes you identified in question 1 of the previous activity, what was the CO2 concentration, luminosity, and day length?
- For each of the icehouse episodes you identified in question 2 of the previous activity, what was the CO2 concentration, luminosity, and day length?
- Which of these factors is most closely correlated with rises and falls in average global temperature?
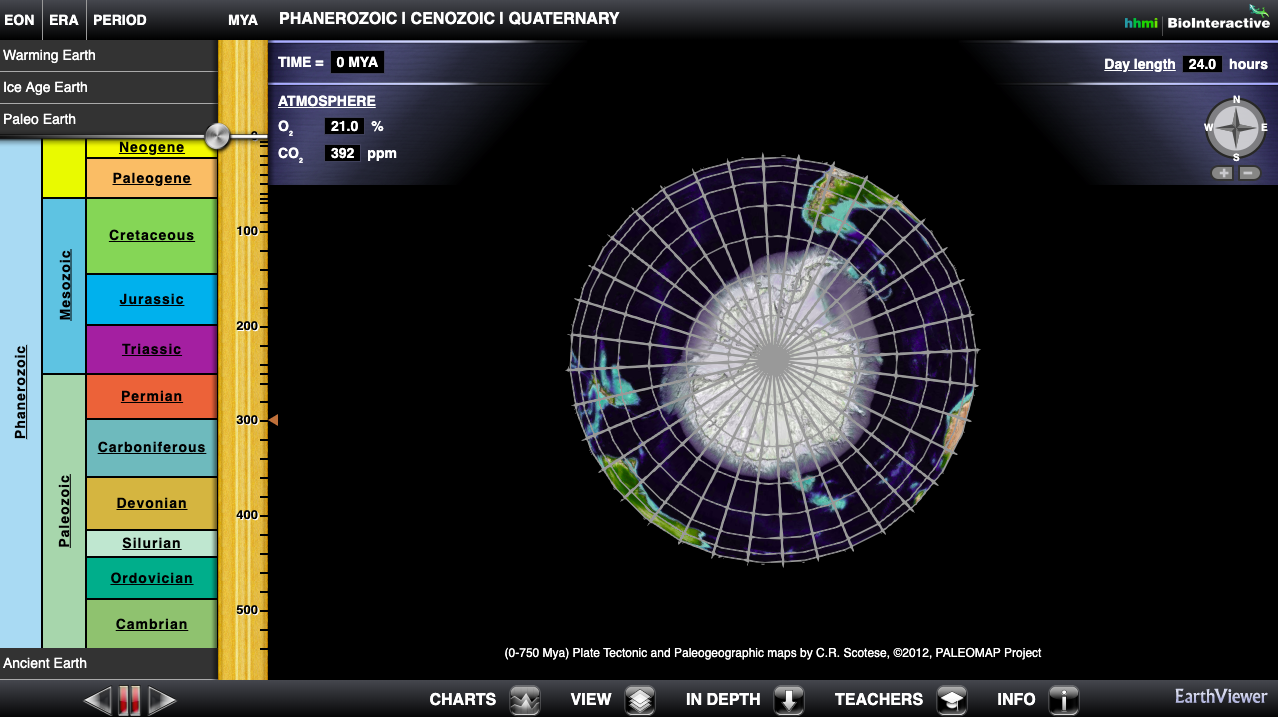
Next set the calendar for “Paleo Earth” and rotate the globe so you are looking straight down onto the south pole (see figure 2).
- Between 540 million years ago and the present when did icecaps appear at the South Pole?
- How did the appearance of these ice caps correspond the with the timing of icehouse and hothouse episodes you identified in question 4 of the previous activity?
- During the past 540 million years when did ice appear at the North Pole?
- How did this the appearance of polar ice at the North Pole correspond to appearance at the South Pole?
- What do you think accounts for any of the differences you may have noticed in question 7?
|
|
Figure 2Earth Viewer with the calendar set to “Paleo Earth”. The globe is rotated so you are looking straight down onto the South Pole. The white coloring is largely ice-covered land with sea ice drawn with a dark blue. |
Activity C – Climate Impacts
To begin set the calendar to “Ice Age Earth” and the time slider to 21,000 years. With these settings as your starting point use the viewer to answer the following questions…
- Between now and 21,000 years ago what happened to the global ice of the world? Be specific here by referring to places that either gain or lose ice as you move forward in time.
- What is meant by relative sea level? For information about this question click on the label “Relative Sea Level” in the upper right corner of the screen.
- Between now and 21,000 years ago what happened to relative sea level? Again, be specific. What was RSL 21,000 years ago? What was is it now?
- When was the change in sea level the most rapid? When was it the most stable? To answer this question, open the RSL graph by selecting Relative Sea Level from the “Charts” menu at the bottom of the screen (Figure 3).
- For the climate model used in Earth Viewer, how much is average global temperature forecasted to increase by 1000 years from now?
- Given this temperature increase what is the forecasted rise in sea level?
- What changes in the Arctic and Antarctic might you expect to see in the next millennium?
- Continuing forward in time when might the earth become ice free? In other words when would all the major glaciers, ice sheets, and sea ice disappear from the planet?
- What is relative sea level at this time?
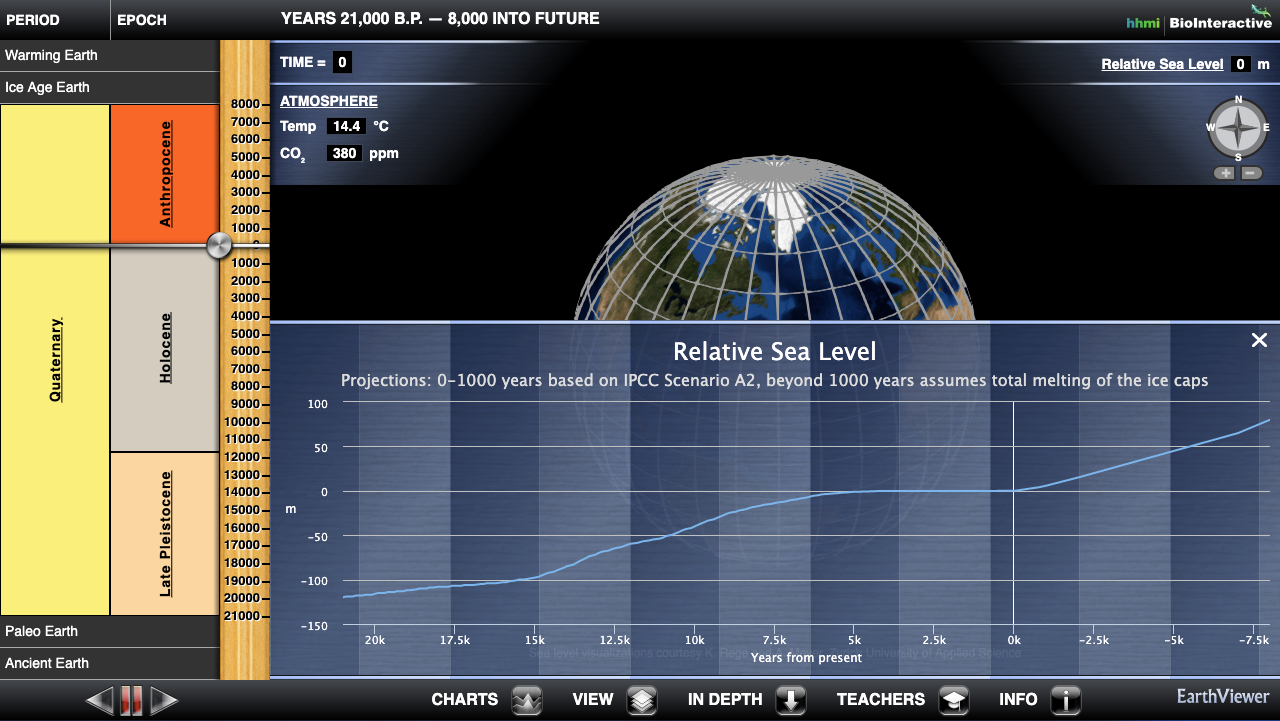 |
Figure 3Earth Viewer with the calendar set to “Ice Age Earth”. The graph overlain onto the globe is for Relative Sea Level (Sea level relative to present day). This can be accessed by selecting “Relative Sea Level” from the “Charts” menu at the bottom of the screen. Other options available from that menu are temperature and CO2. |
Activity D – Synthesis
- Given what you found out in the past three activities write a more complete definition for Icehouse and Hothouse than the one in the background section of this activity set?
- Summarize what causes icehouse and hothouse episodes on the basis of what you discovered in activity B.
- Explain the relationship between sea level, global ice, and temperature on the basis of your results in activity C. Are there other factors in this relationship that were not explored in that activity?
