5 Vignette 5: Marine terraces and uplift rate
Adam Booth
THEORY
Marine terraces are former marine-cut platforms that have been uplifted relative to current sea level so that they are no longer inundated by sea water. They appear as nearly flat benches on hillsides along rocky coasts that have experienced uplift (Figure 1). An example of a present day marine-cut platform was shown in Chapter 1, Figure 1, and if that platform is uplifted relative to sea level in the future, it would become a marine terrace. So to understand how marine terraces form, we need to understand how wave-cut platforms are created in the first place.

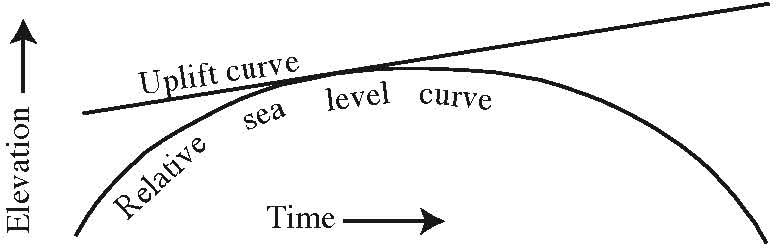
For a marine-cut platform to develop, relative sea level needs to be stable for some period of time so that wave action can erode laterally into the coast line. If sea level is rising or falling too quickly, wave action is eroding at different relative elevations at different times, and not spending enough time eroding at the same relative elevation in order to create a planar feature.
Throughout the Quaternary, eustatic sea level has fluctuated by more than 100 m through repeated glacial-interglacial cycles and has rarely remained at a steady elevation for long. For example, typical rates of sea level rise or fall have been on the order of 10 cm/yr as land-based glaciers and ice sheets have shrunk or grown, respectively. This is quite fast compared to typical bedrock uplift rates of coasts, which only exceed 1 cm/yr in a few very tectonically active locations.
For relative sea level to hold steady for a period of time so that a wave-cut platform can be created, the local uplift rate must match the local rate of sea level rise. This usually happens at times that just precede sea level high stands, when the rate of sea level increase slows and temporarily matches that of uplift (Figures 2 and 3). Note that this could also occur immediately following sea level low stands, but marine terraces are not typically associated with low stands, partly because wave-cut platforms that potentially formed at those times are either still under water or have been obscured by later wave-cut platforms formed at subsequent high stands.

Since marine terraces formed under known conditions and have a distinct shape that can be discerned in the landscape today, they are excellent geomorphic markers for determining uplift rates. Uplift rate is defined as the change in elevation of a bedrock marker divided by the time since the marker was formed:
Equation 1:
[latex]U=\frac{z-z_0}{Δt}[/latex]
where [latex]U[/latex] is uplift rate [L/T], [latex]z[/latex] is the present day elevation of the terrace [L], [latex]z_0[/latex] is the elevation at which the terrace was formed, and [latex]Δt[/latex] is the age at which the terrace was formed [T], i.e. the change in time from wave-cut platform formation to the present.
Case study: Crete, Greece
One convenient way to visualize how uplift rate can be determined from marine terraces is to view two plots side-by-side with a shared y-axis: one of sea level relative to that of present day versus time and one of terrace elevation versus horizontal distance (Figure 3).
If we connect each sea level high stand to its associated terrace elevation with a straight line, the slope of that line is by definition (Equation 1) the average uplift rate since the time that terrace originally formed. Next, let’s practice reading the relevant elevations and times off a plot and calculating uplift rates over different time scales.

Example: Determining change in uplift rate of coastal Crete, Greece
To determine uplift rates, we can determine each of the variables in Equation 1 from the combined sea level and terrace elevation plot. Present day terrace elevations, [latex]z[/latex], have already been determined on the plot, as indicated by the horizontal dashed lines, and they are listed next to each terrace in the terrace elevation profile (Figure 5).
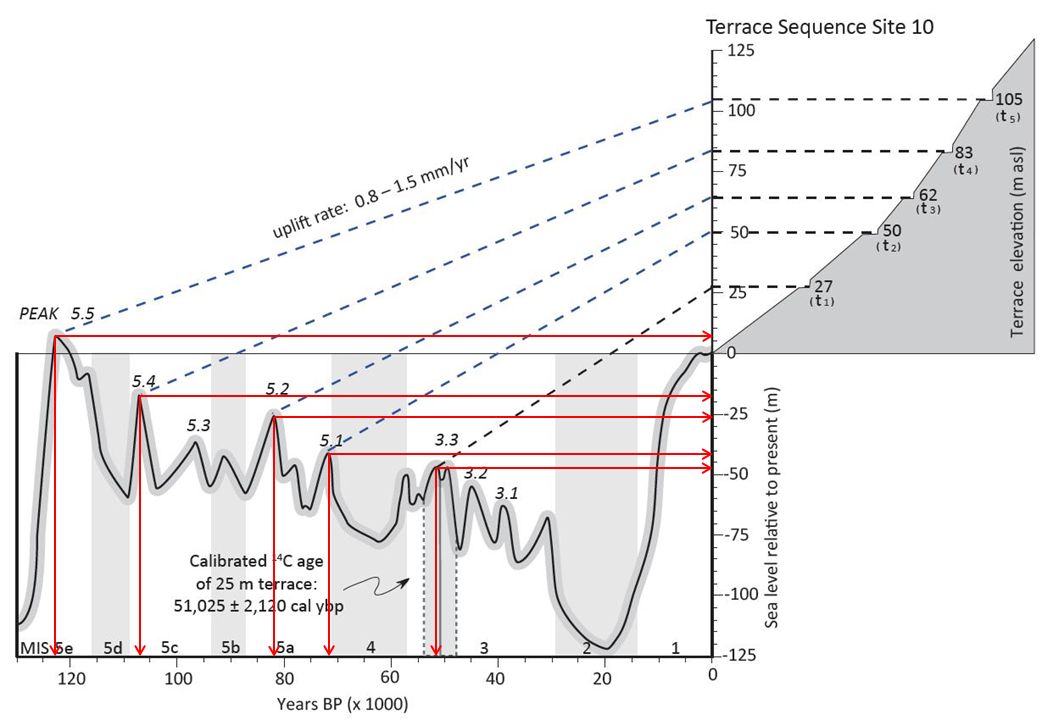
To determine initial elevations of each terrace, [latex]z_0[/latex], draw a horizontal line from the peak of each sea level high stand to the y-axis, as indicated by the horizontal red arrows added to the figure.
For example, terrace 5 formed when sea level was about 7 m higher than it is at present, while terrace 1 formed when sea level was about 48 m lower that present, hence the negative sign (Table 1). Subtracting each terrace’s initial elevation from its current elevation gives us the change in elevation, [latex]z - z_0[/latex].
To get the time since each terrace formed, [latex]Δt[/latex], draw a vertical line from the peak of each sea level high stand down to the x-axis, as indicated by the red vertical arrows added to the figure.
Finally, divide the change in elevation by the terrace age to the get the average uplift rate since the terrace formed. In this example, uplift rates are around 1 mm/yr, much slower than rates of sea level change during fluctuations, and since uplift rates are higher when averaged over more recent time intervals, this tells us that uplift rate has been increasing with time at this site.
| Terrace number | Initial elevation [m] | Current elevation [m] | Change in elevation [m] | Terrace age [yrs] | Average uplift rate [mm/yr] |
|---|---|---|---|---|---|
| 1 | −48 | 27 | 75 | 52,000 | 1.44 |
| 2 | −41 | 50 | 91 | 72,000 | 1.26 |
| 3 | −25 | 62 | 87 | 82,000 | 1.06 |
| 4 | −17 | 83 | 100 | 107,000 | 0.93 |
| 5 | 7 | 105 | 98 | 123,000 | 0.80 |
